Diagrams
The pymadx.Diagrams module provides machine diagrams. These use a MADX
survey output file (TFS format) and require all columns to be present. i.e. do
not select individual columns. For example, in MADX:
select, flag=survey, clear;
survey, file="survey-h6-from-zero.tfs";
The following examples are based on survey output for various machines at CERN from MADX. The TFS format survey files can be found in pymadx/tests/test_input.
Z-X Plane
s = pymadx.Data.Tfs("h6-survey.tfs")
pymadx.Diagrams.Survey2DZX(s)
This will use the default colours and widths for the various components.
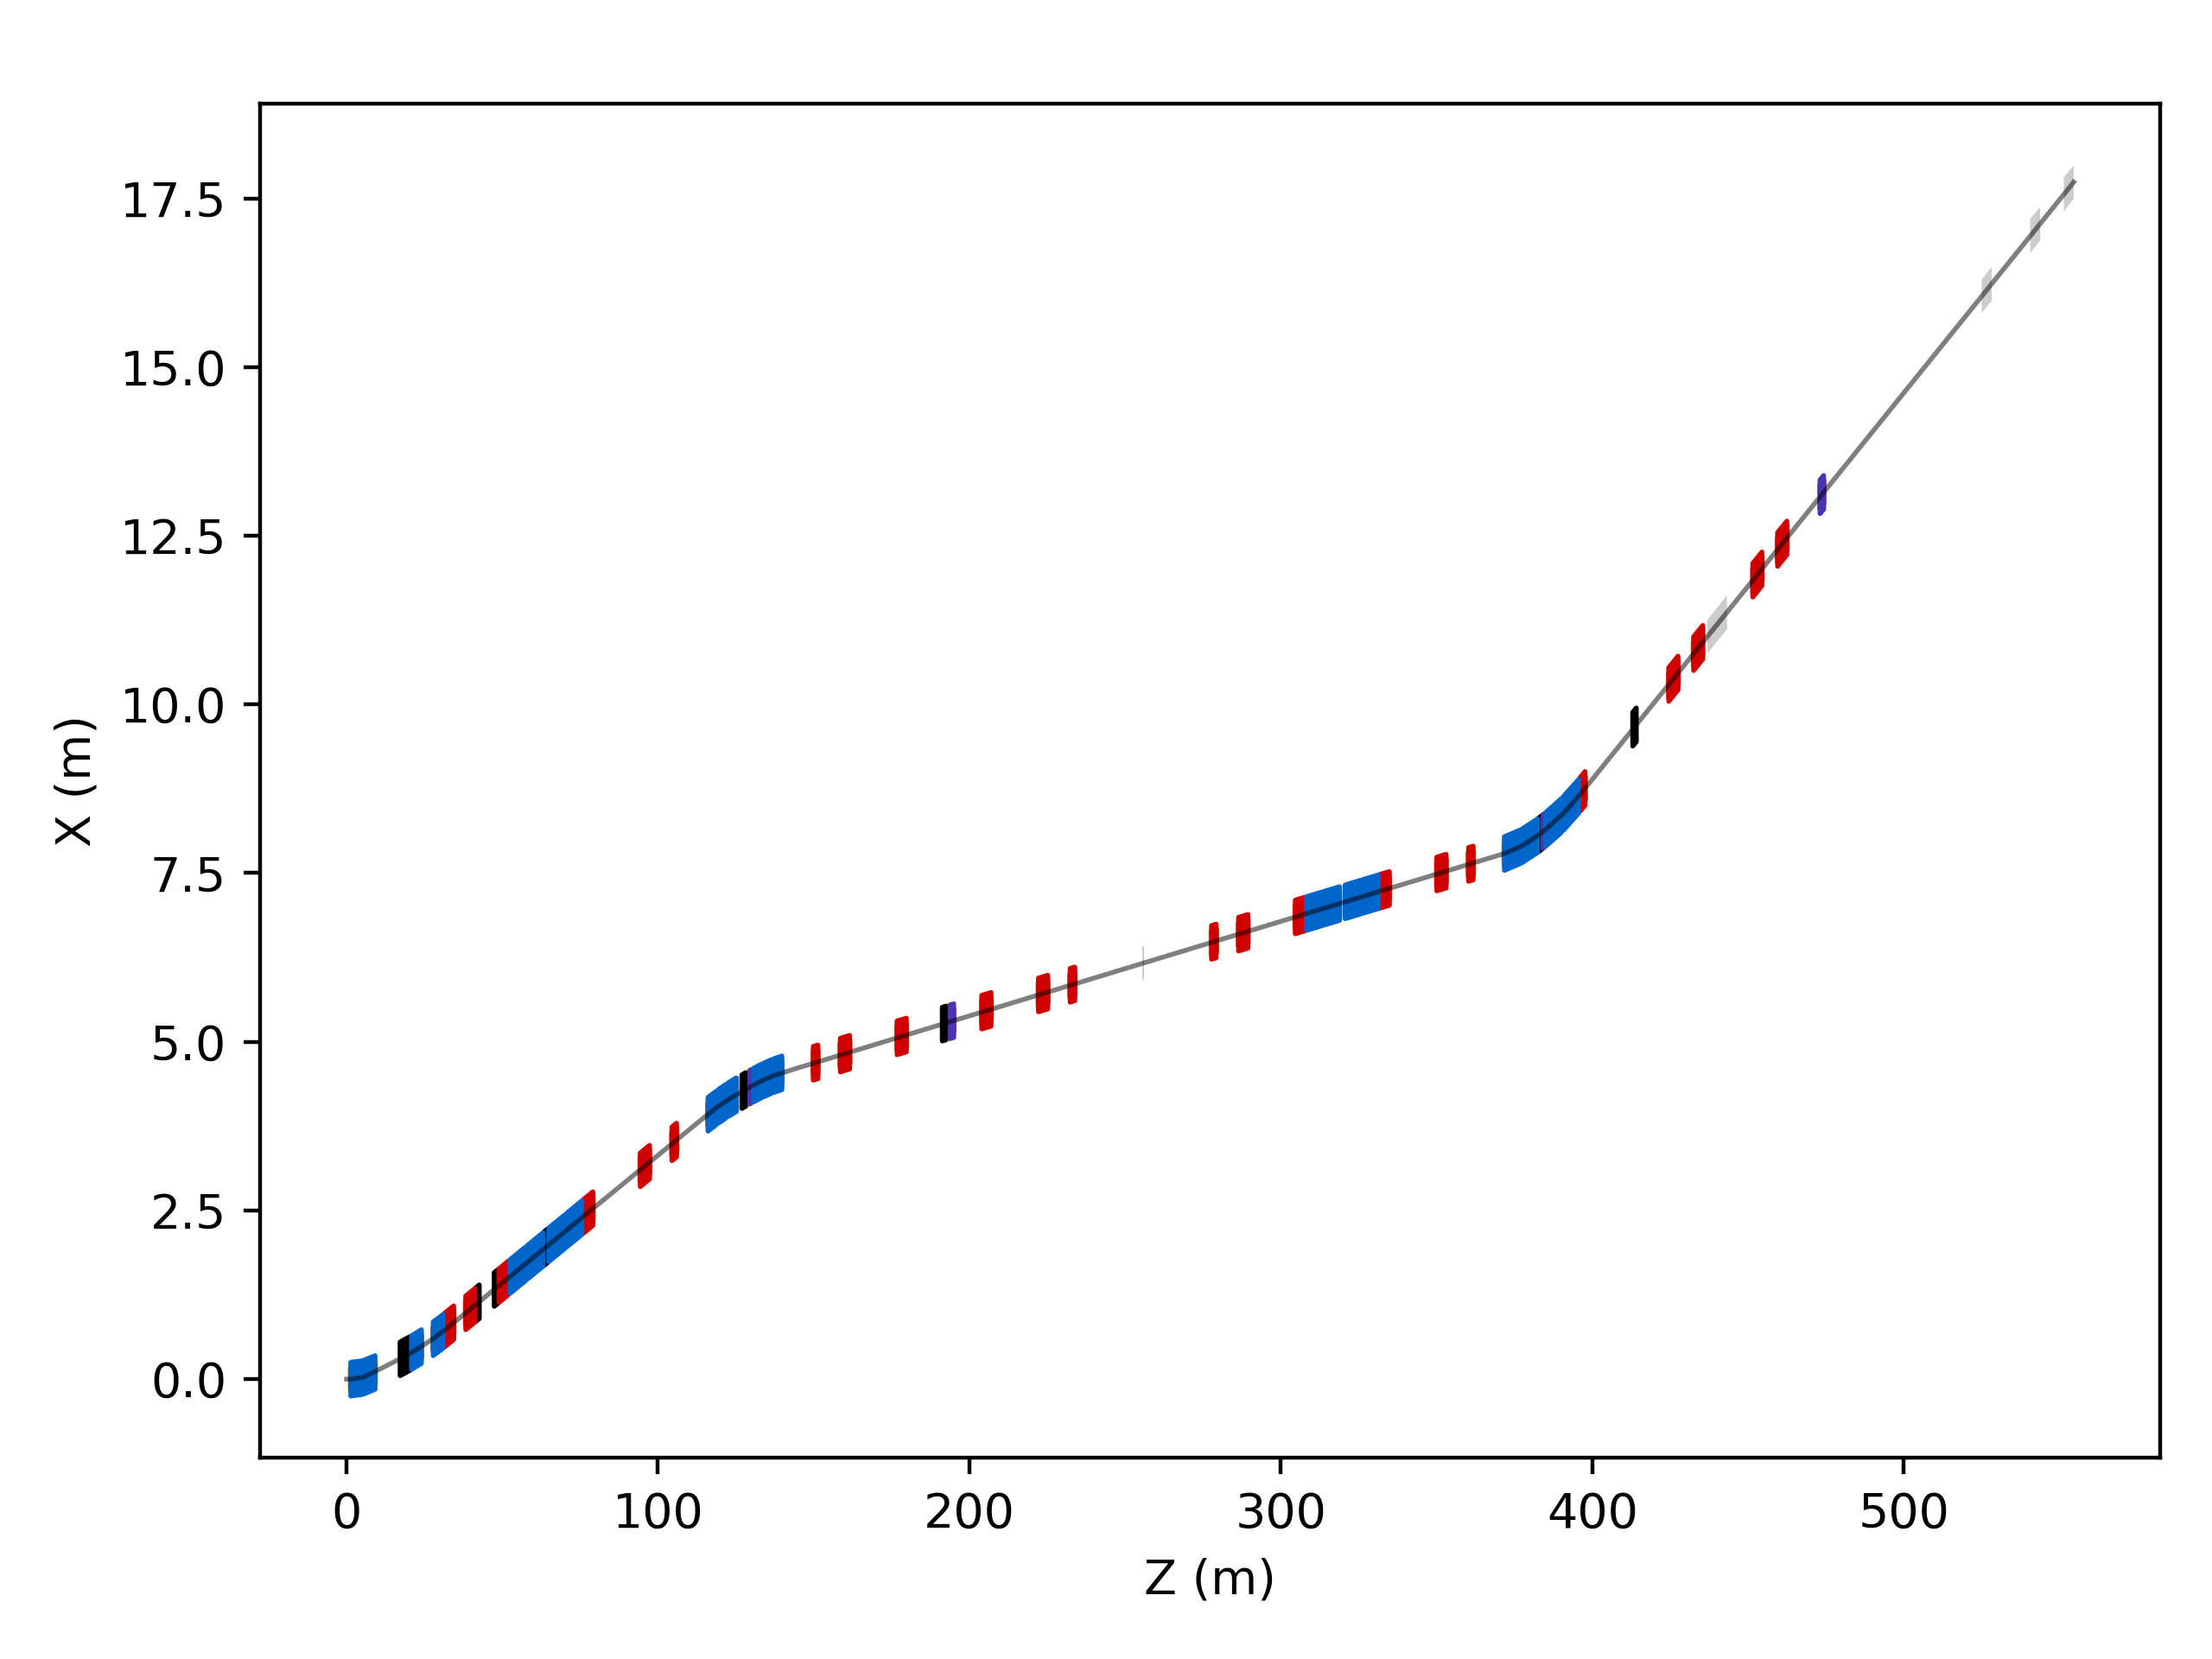
Default style ZX diagram.
Offsetting
An overall global offset and rotation can be specified in two ways. Firstly, by naming an element. Secondly, by providing a roto-translation yourself, potentially from another survey if combining machine diagrams.
s = pymadx.Data.Tfs("h6-survey.tfs")
pymadx.Diagrams.Survey2DZX(s, offsetRotoTranslation="XWCA.X0410404")
s = pymadx.Data.Tfs("h6-survey.tfs")
offset = s.GetRotoTranslationFromElementZX("XWCA.X0410404")
pymadx.Diagrams.Survey2DZX(s, offsetRotoTranslation=offset)
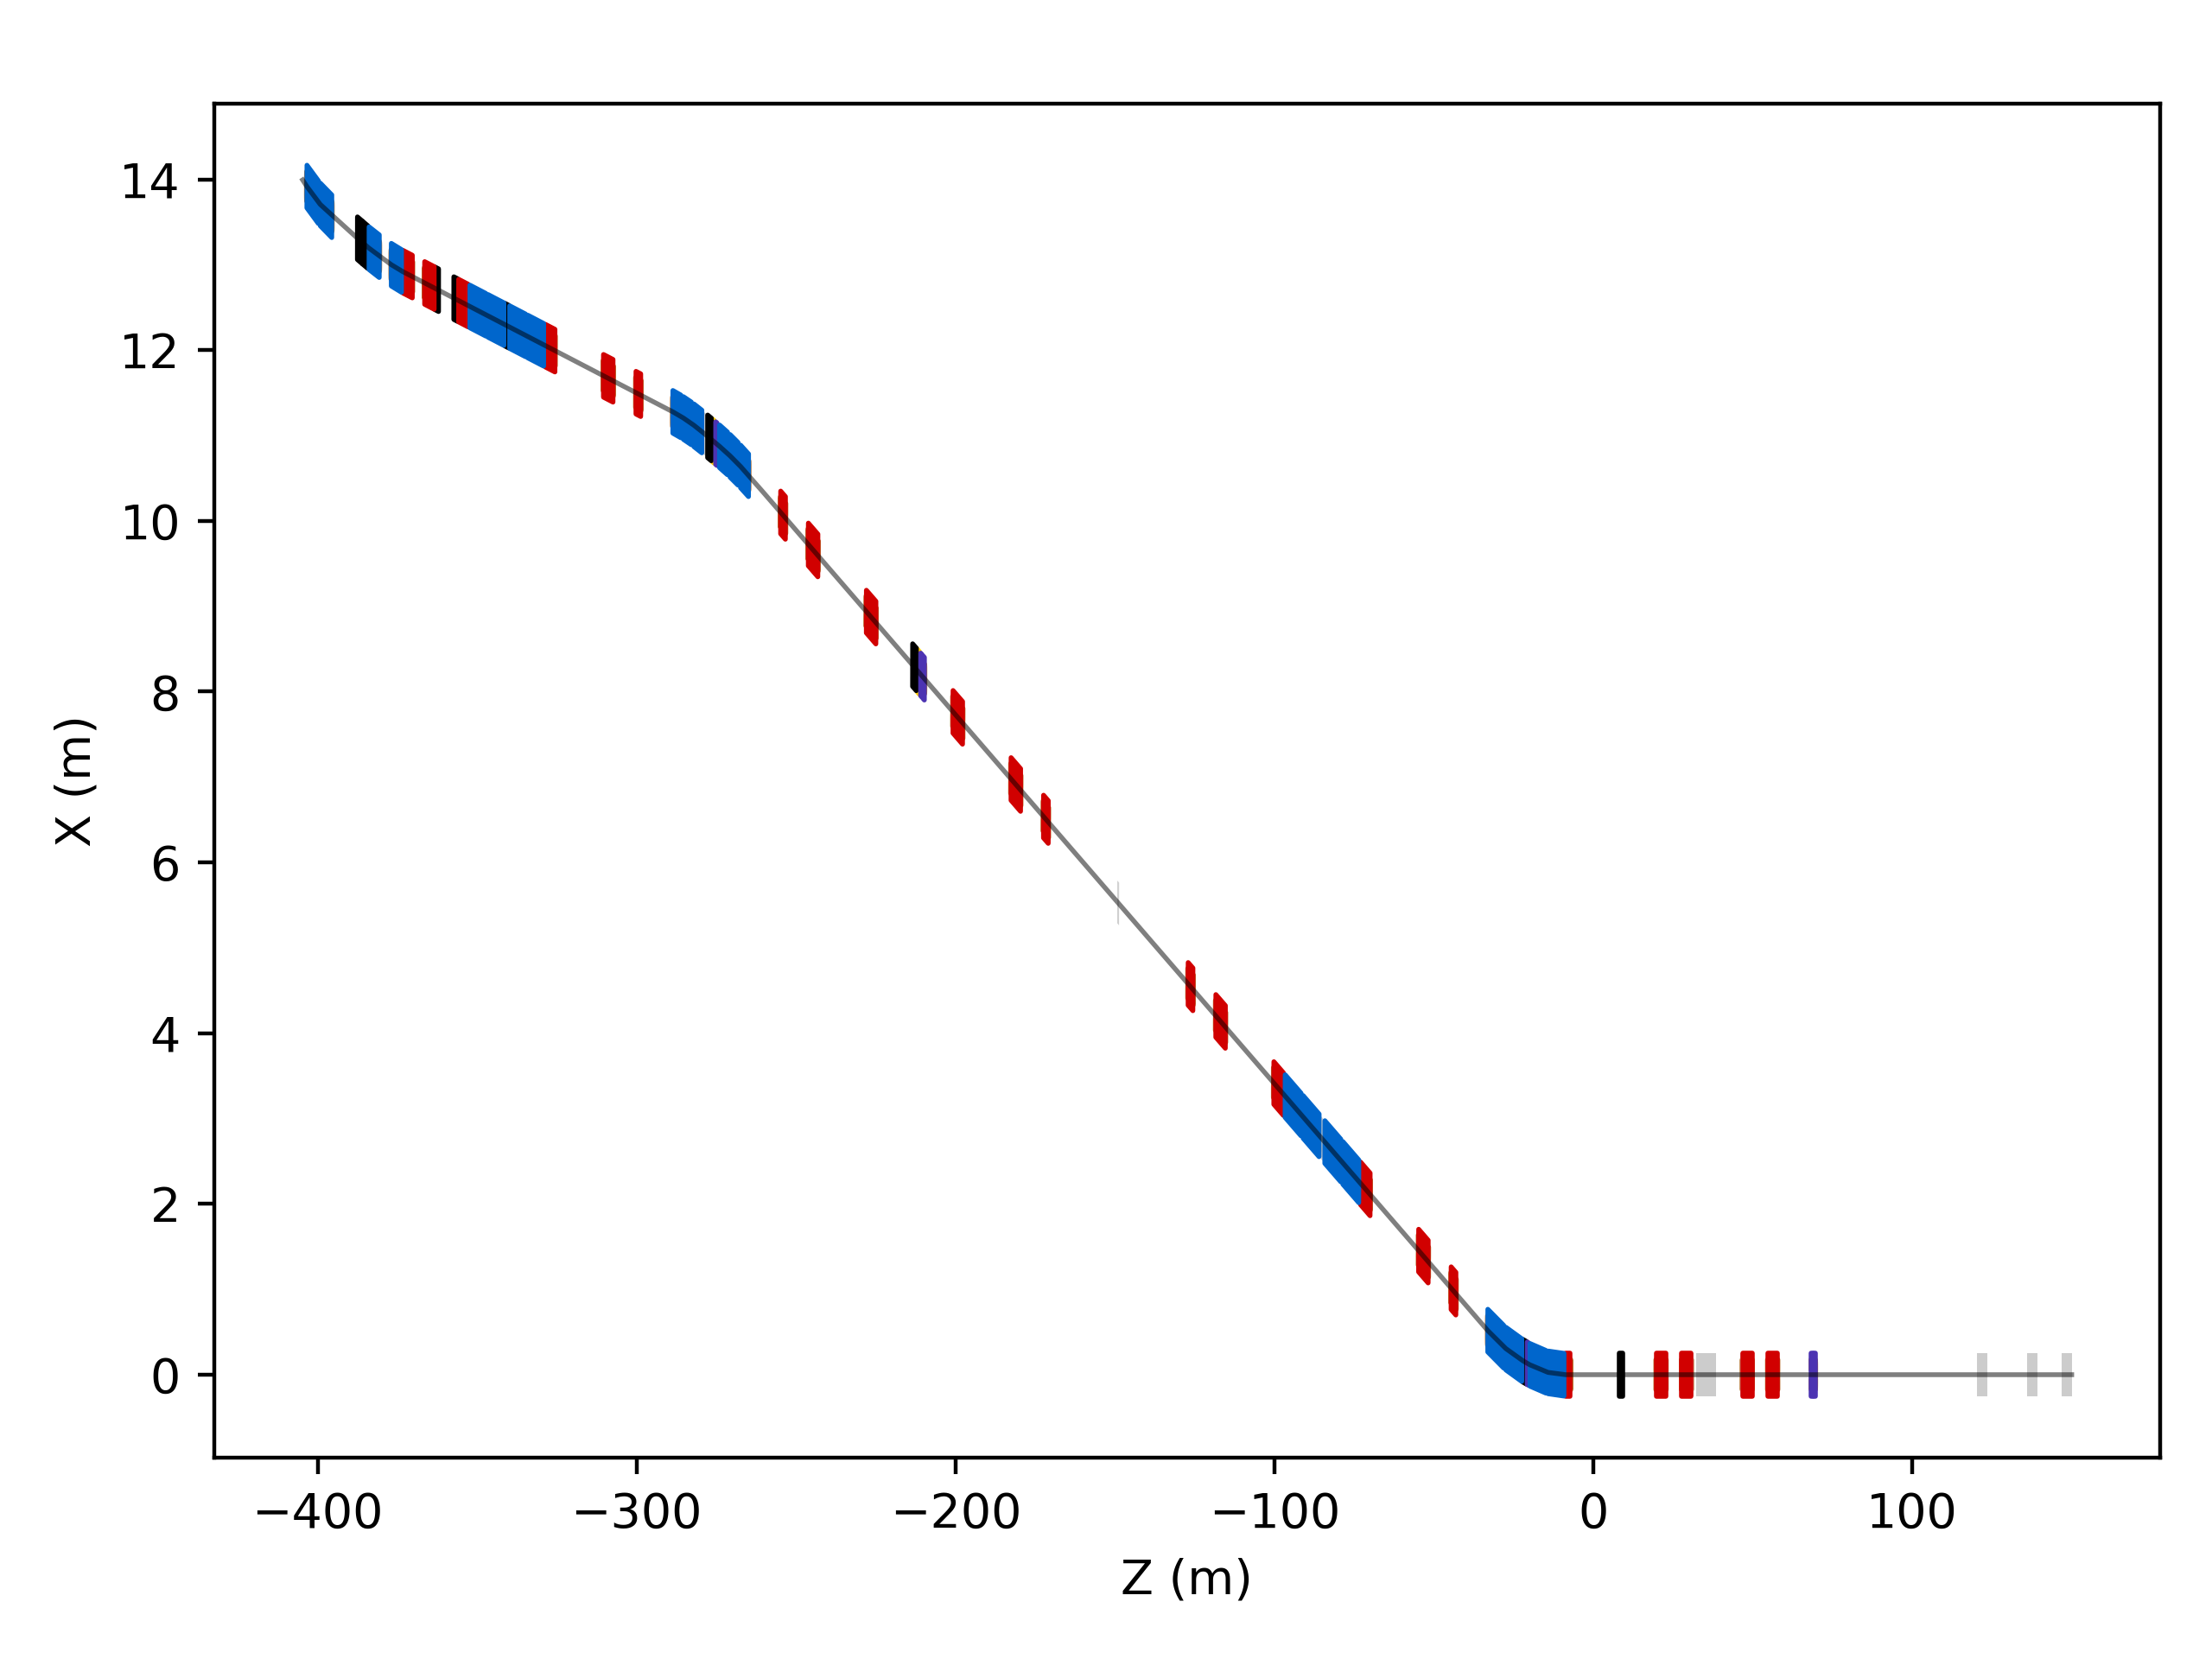
Offset by name for element XWCA.X0410404.
Multiple Machines
More than one machine diagram can be combined by providing a matplotlib axis instance to draw into. The z-order can also be specified with a higher integer number meaning in front.
h6 = pymadx.Data.Tfs("h6-survey.tfs")
h8 = pymadx.Data.Tfs("h6-survey.tfs")
fig, ax = pymadx.Diagrams.Survey2DZX(h6)
pymadx.Diagrams.Survey2DZX(h8, ax=ax, zOffset=2)
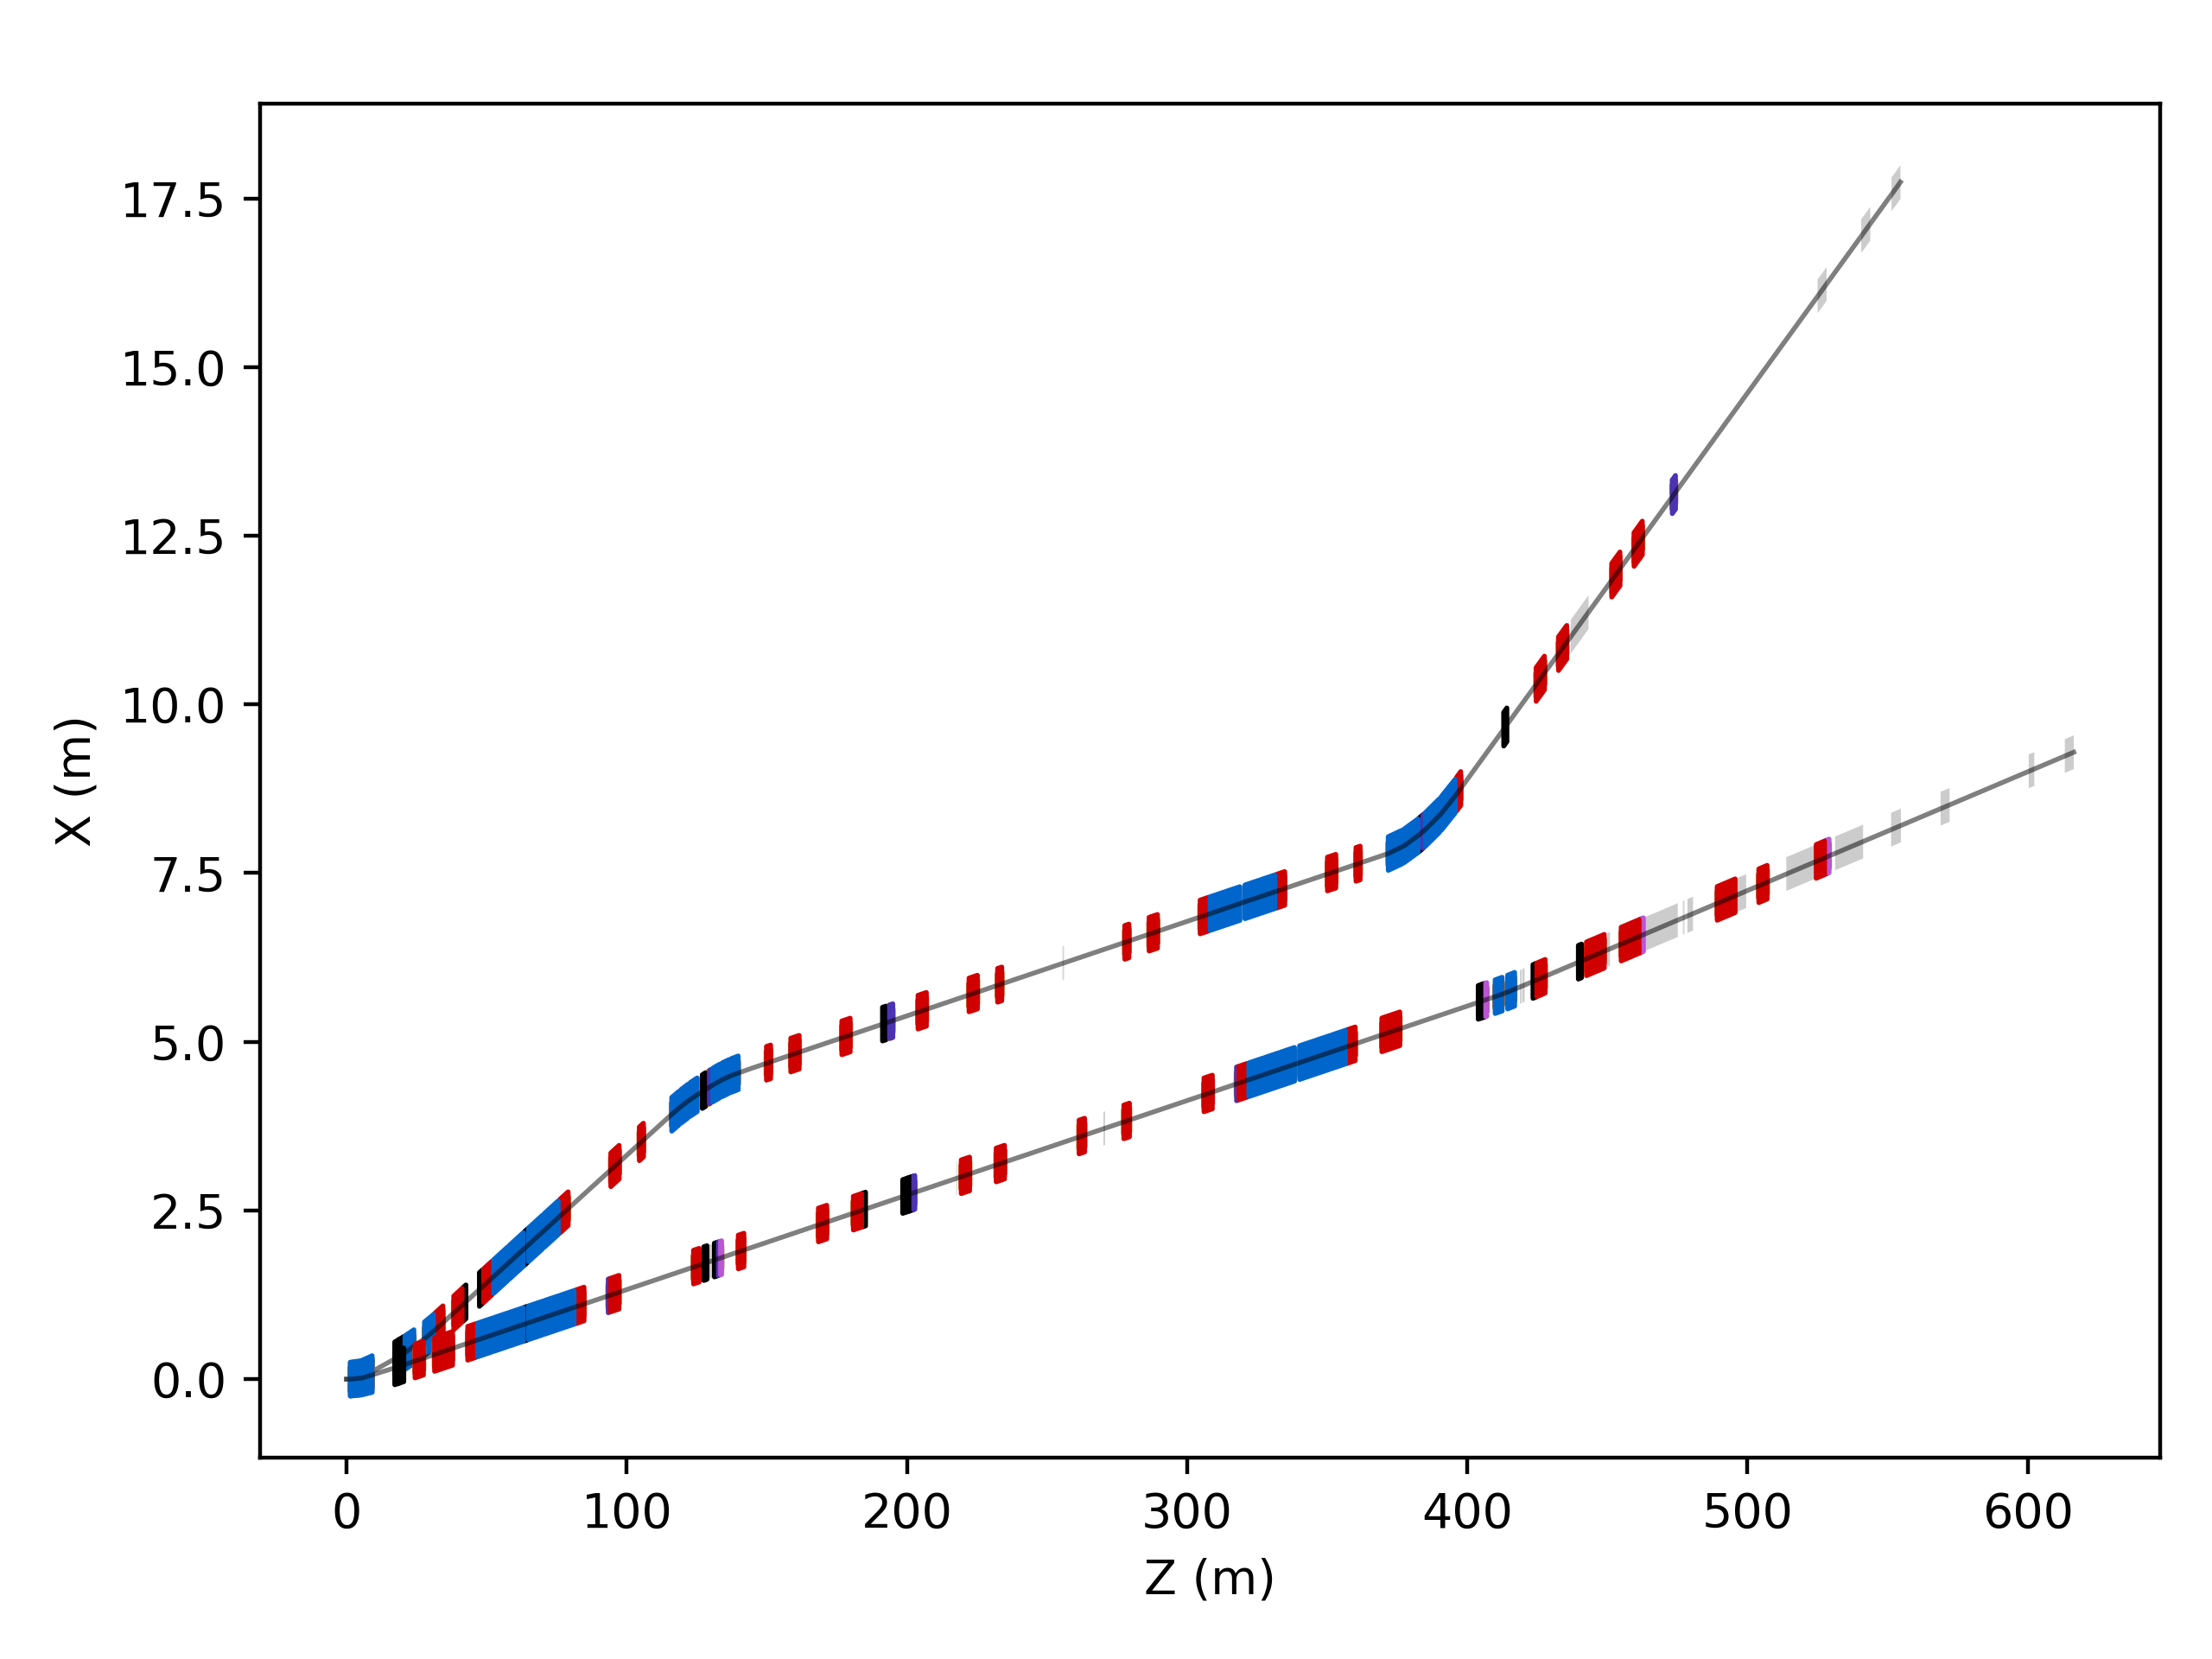
Beamlines H6, H8 at CERN shown overlapped.
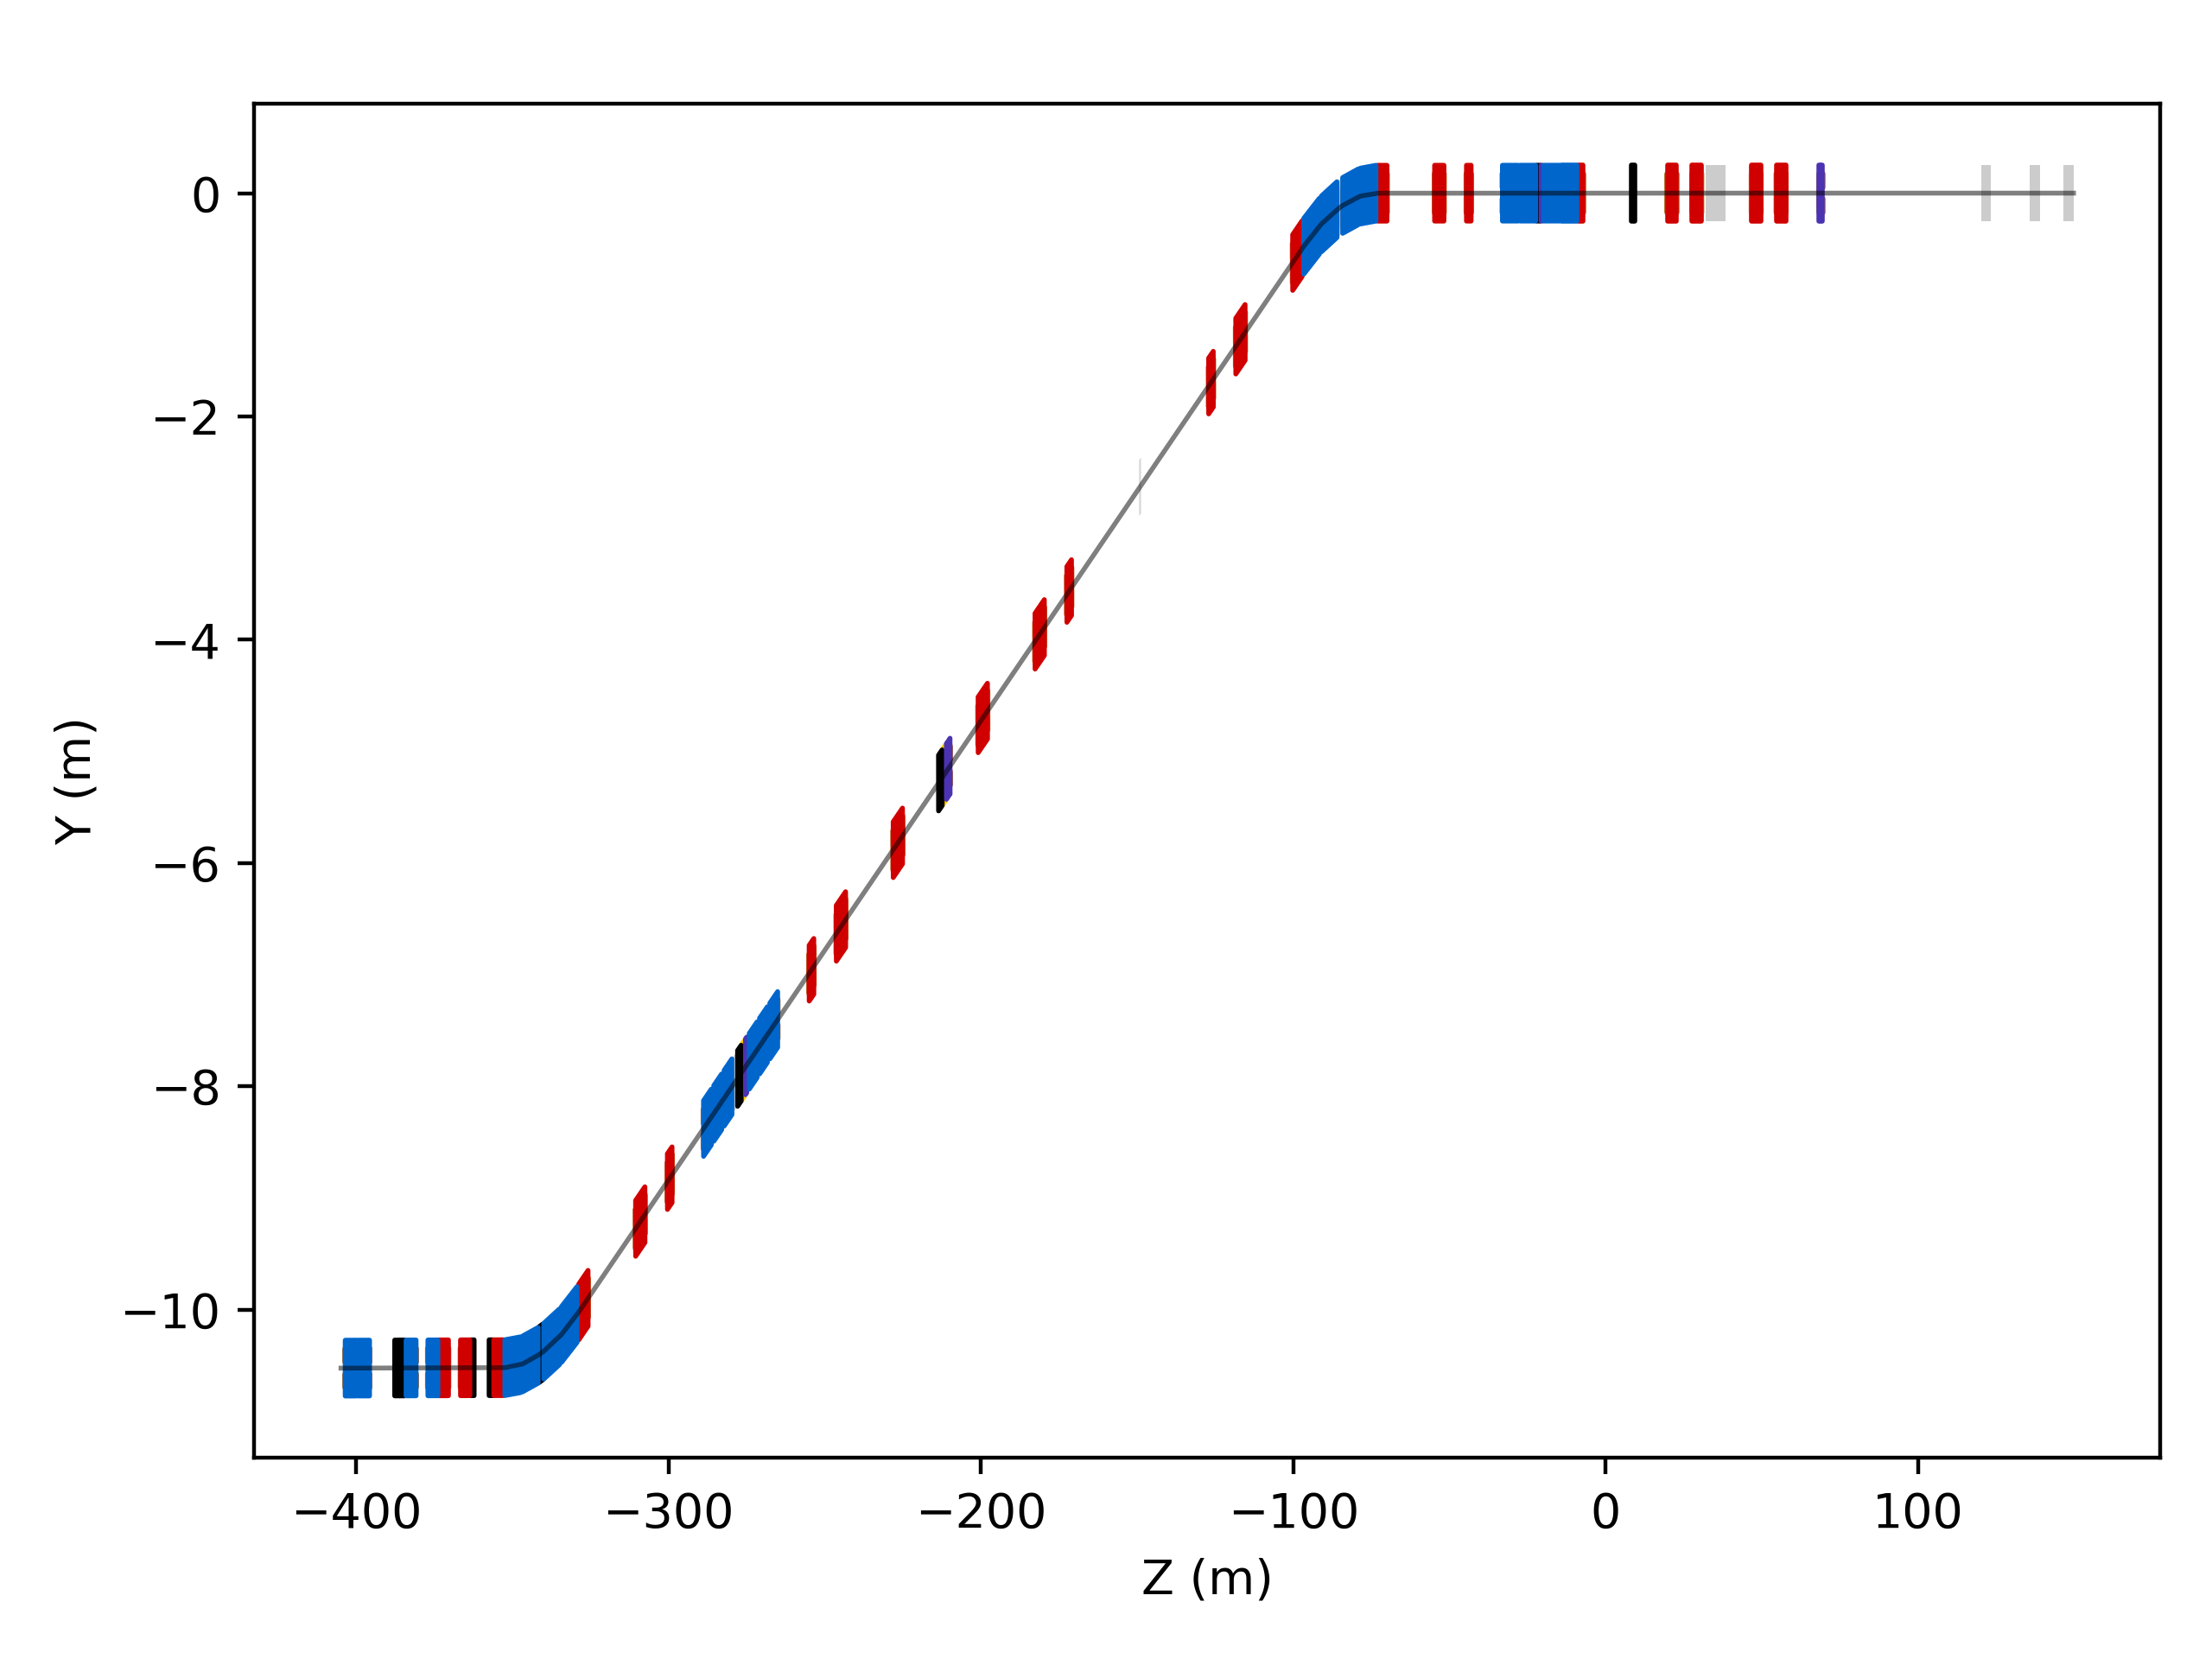
Z-Y Plane
s = pymadx.Data.Tfs("h6-survey.tfs")
pymadx.Diagrams.Survey2DZY(s)
This will use the default colours and widths for the various components.
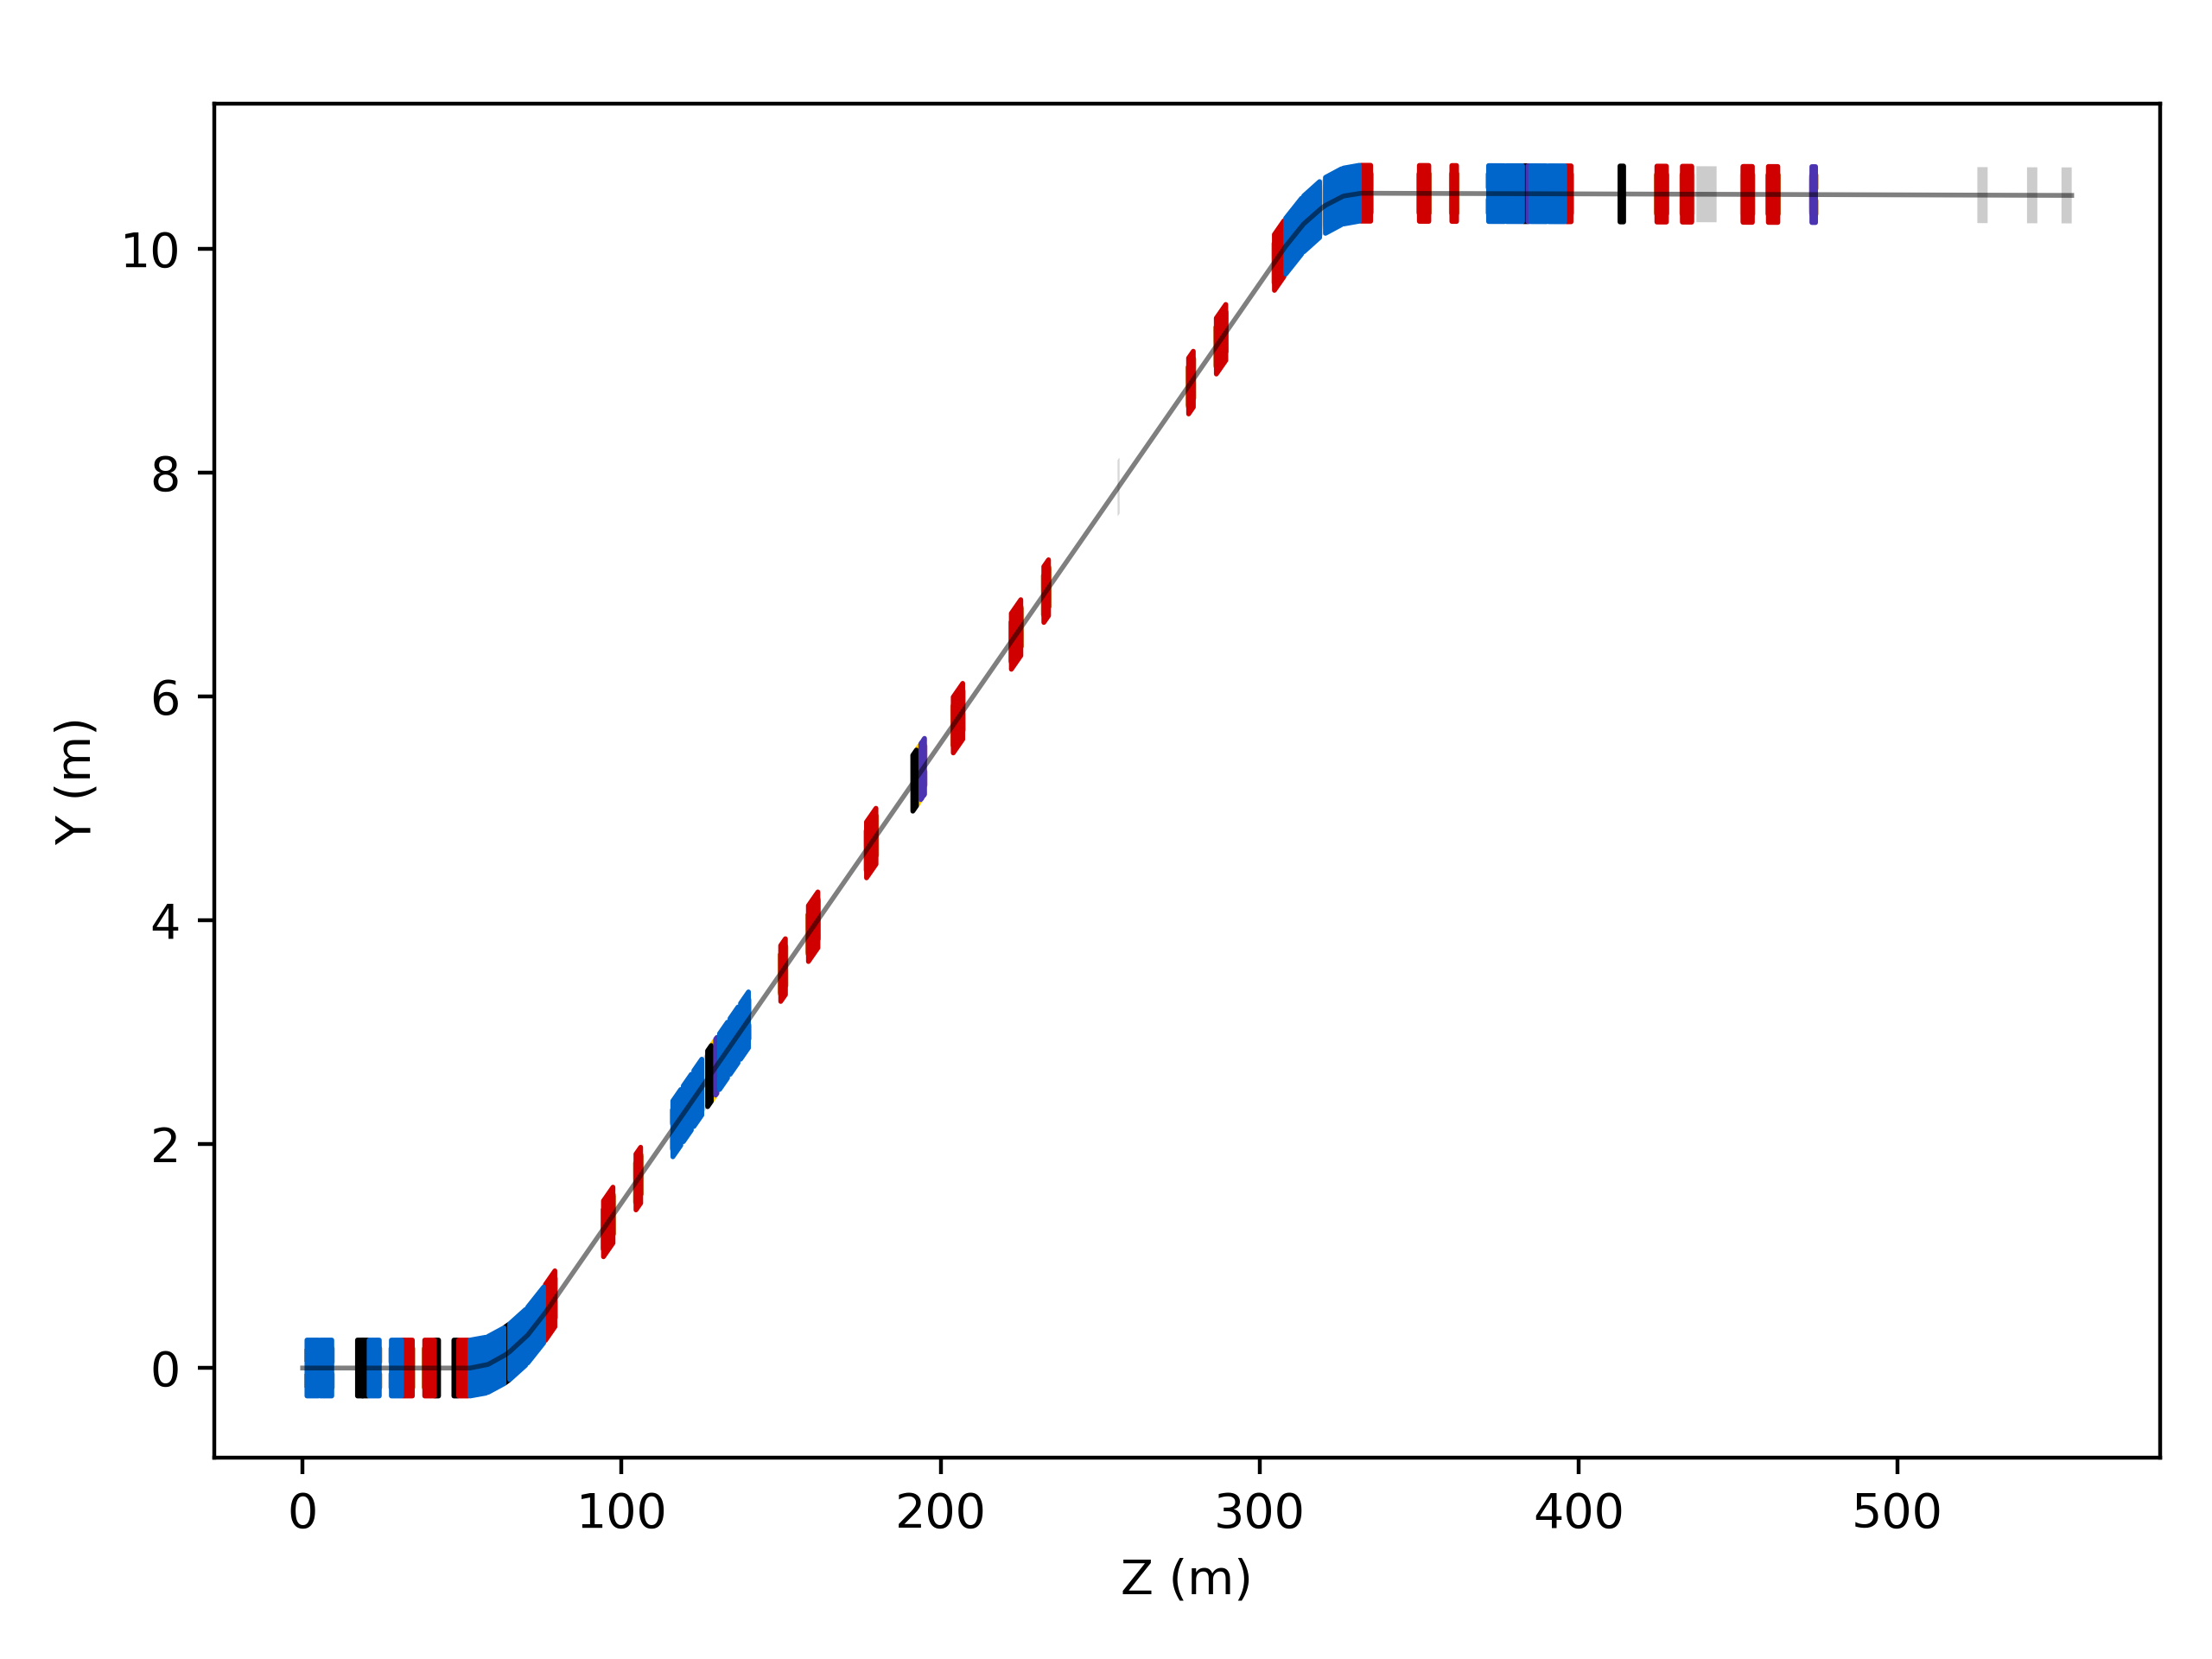
Default style ZY diagram.
Offsetting
An overall global offset and rotation can be specified in two ways. Firstly, by naming an element. Secondly, by providing a roto-translation yourself, potentially from another survey if combining machine diagrams.
s = pymadx.Data.Tfs("h6-survey.tfs")
pymadx.Diagrams.Survey2DZY(s, offsetRotoTranslation="XWCA.X0410404")
s = pymadx.Data.Tfs("h6-survey.tfs")
offset = s.GetRotoTranslationFromElementZX("XWCA.X0410404")
pymadx.Diagrams.Survey2DZY(s, offsetRotoTranslation=offset)
Offset by name for element XWCA.X0410404.
Multiple Machines
More than one machine diagram can be combined by providing a matplotlib axis instance to draw into. The z-order can also be specified with a higher integer number meaning in front.
h6 = pymadx.Data.Tfs("h6-survey.tfs")
h8 = pymadx.Data.Tfs("h6-survey.tfs")
fig, ax = pymadx.Diagrams.Survey2DZX(h6)
pymadx.Diagrams.Survey2DZY(h8, ax=ax, zOffset=2)
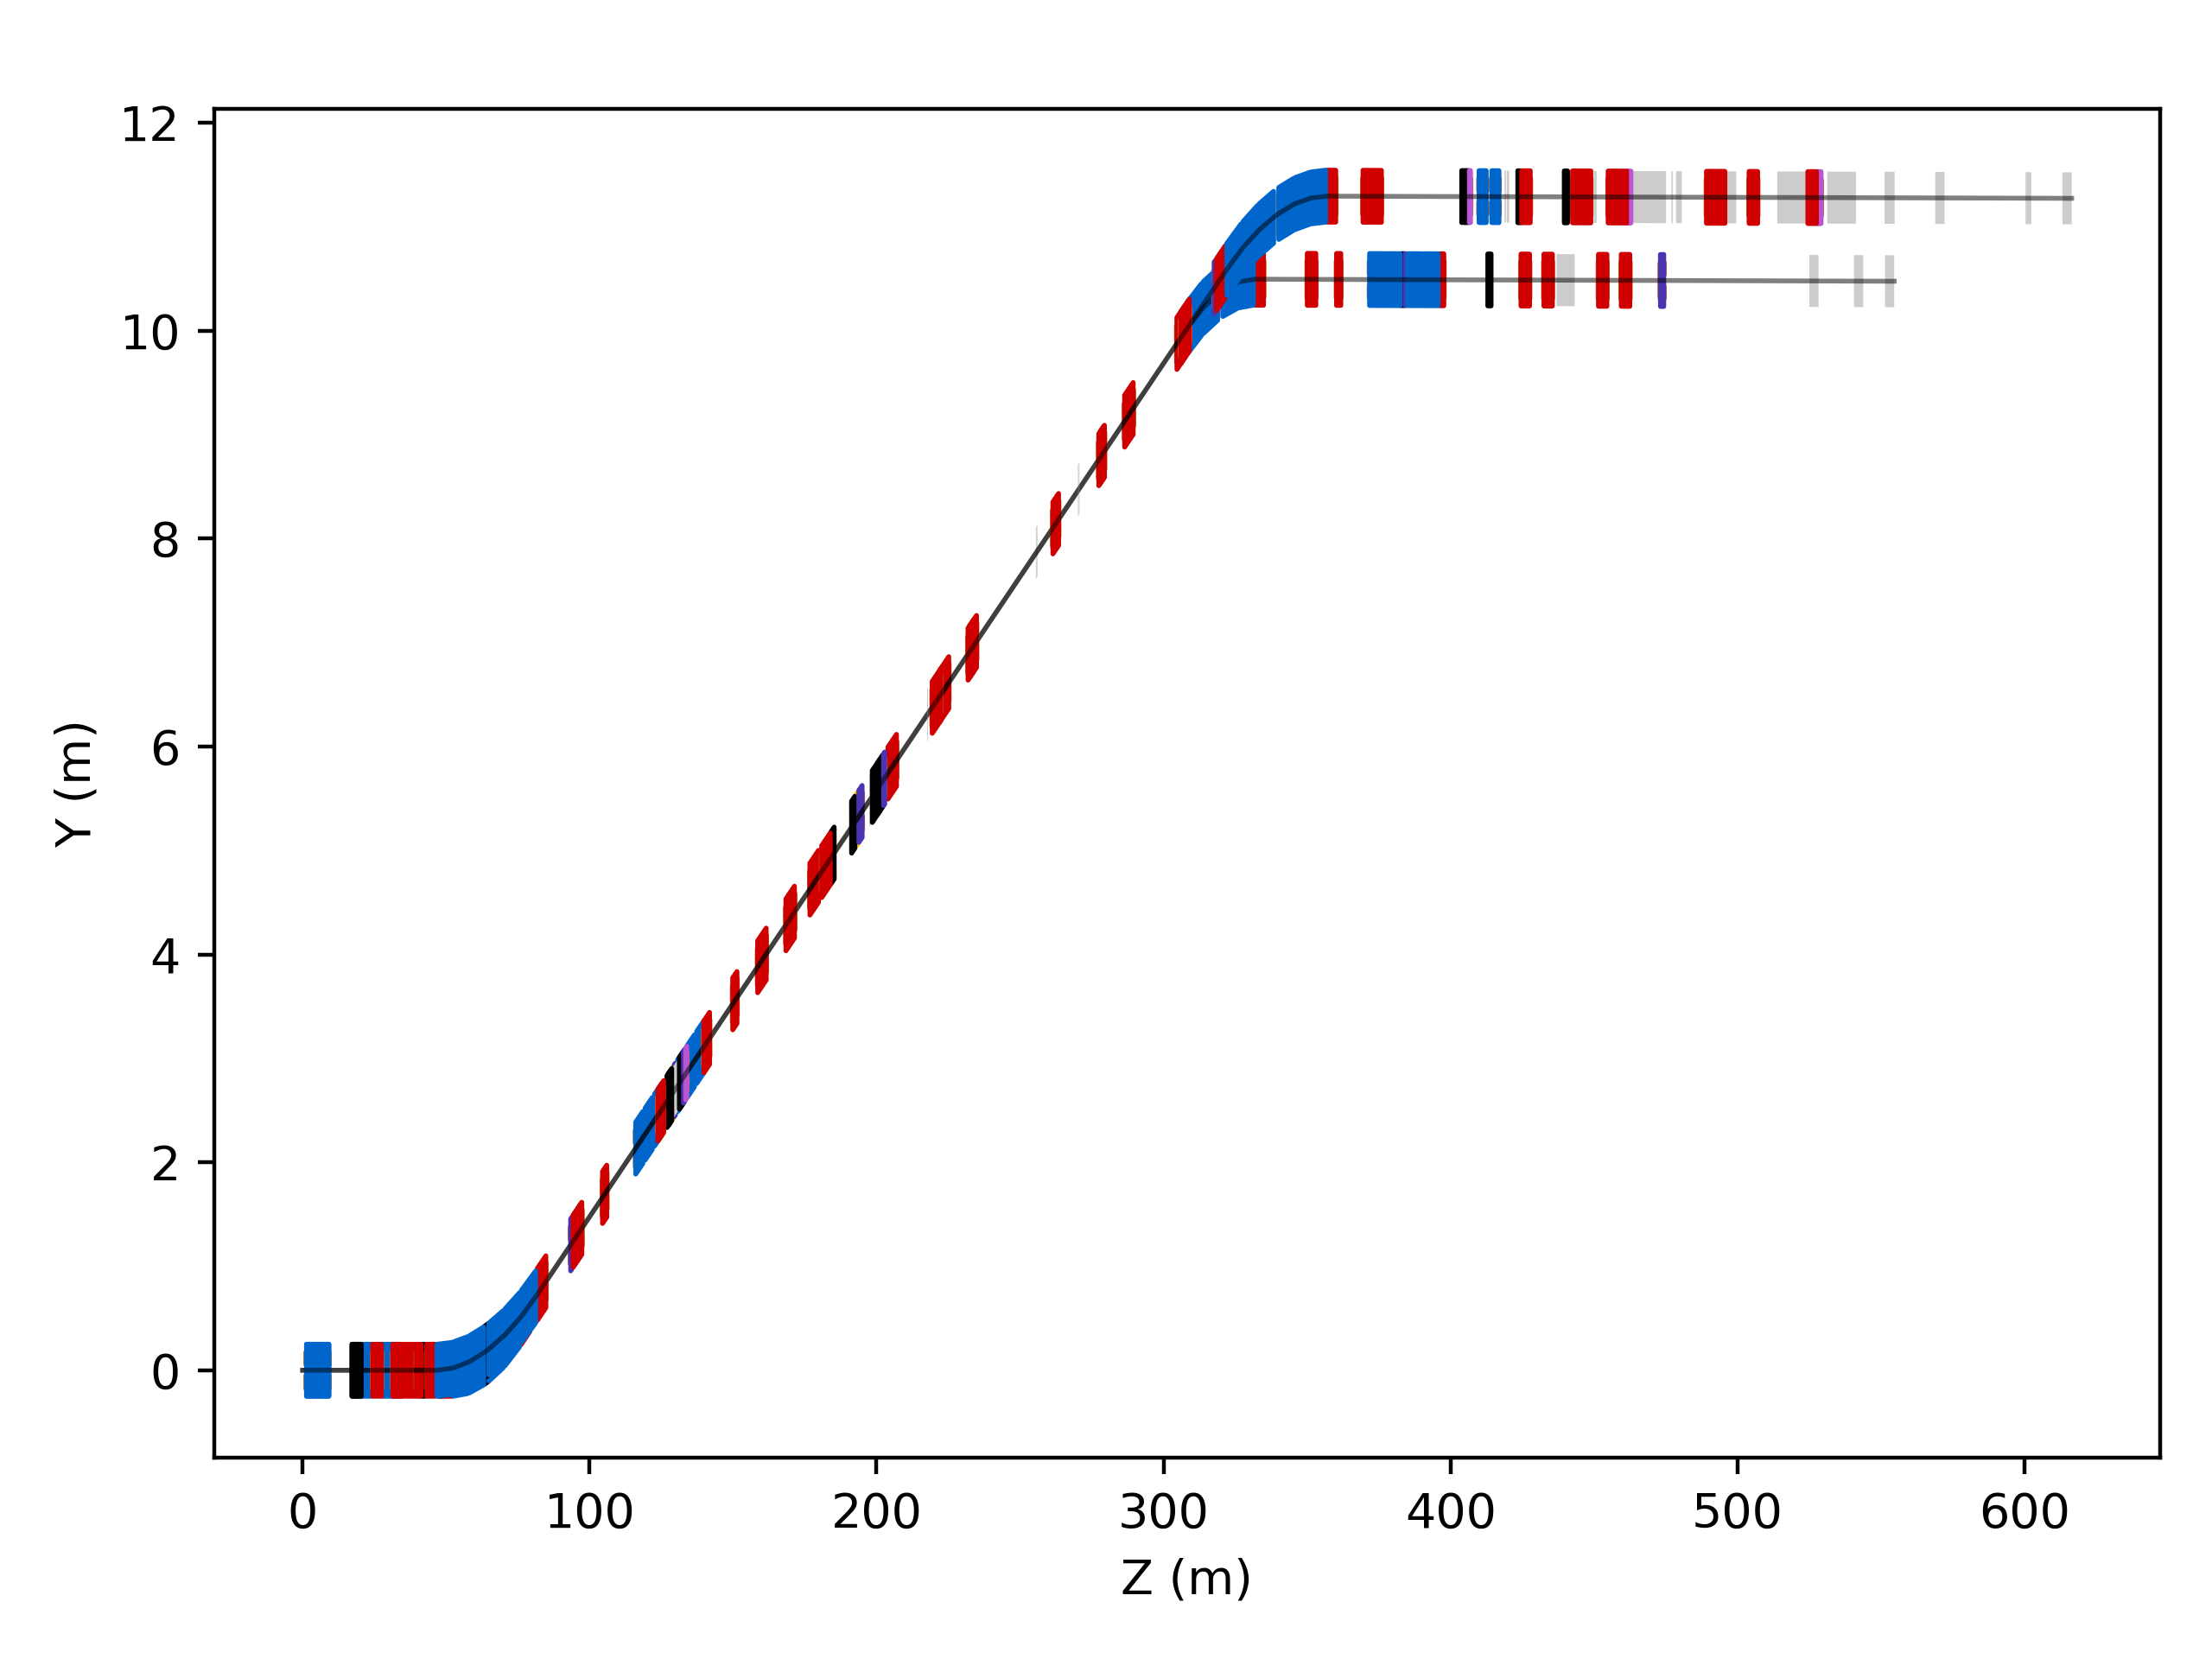
Beamlines H6, H8 at CERN shown overlapped.
Styling
The diagram can be customised by supplying a dictionary of parameters. The parameters are matched up with a substring part of element name in the file. The following parameters are accepted:
Parameter |
Description |
|---|---|
‘width’ |
full horizontal width in reality of magnet (m) |
‘height’ |
full vertical height in reality of magnet (m) |
‘dx’ |
offset in horizontal of magnet from axis (m) |
‘dy’ |
offset in vertical of magnet from axis (m) |
‘coil_length’ |
full length coils stick out at end of magnet (m) |
‘coil_width’ |
full width of coils (m) |
‘coil_height’ |
full height of (both) coils at end of magnet (m) |
‘coil_dx’ |
horizontal shift of coils from axis (m) |
‘coil_dy’, |
vertical shift of coils form axis (m) |
‘inside’ |
if the c-shaped yoke is on the inside of the bend (True / False) |
‘style’ |
‘normal’ or ‘fancy’ - only applies to collimators |
The customisation can be done on a specifically named element basis and also in a more
general naming matching ‘type’ basis. These are done with the elementDict and
typeDict dictionaries respectively. An example is given below of full customisation.
elemDict = {'MBXHC.X0410117' : {'inside': False},
            'MBXHC.X0410121' : {'inside': False},
            'MBXHC.X0410124' : {'inside': False},
            'MBXHC.X0410132' : {'inside': False},
            'MBXHC.X0410135' : {'inside': False},
            'MBXHC.X0410139' : {'inside': False},
            }
typeDict = {'MCA' : {'width': 1.25, 'height': 1.25, 'dx': 0.14, 'colour': r'#a7d9b0', 'coil_length': 0.31,
                     'coil_width': 0.8, 'coil_dx': -0.14},
            'MSN' : {'width': 0.47, 'height': 0.3, 'dx': 0.11, 'coil_length': 0.1, 'coil_width': 0.25, 'coil_dx': -0.11},
            'MTN' : {'width': 1.2, 'height': 0.69, 'colour':r'#b2d6c0', 'coil_length': 0.1, 'coil_width': 0.6},
            'MBXHC' : {'width': 1.246, 'height': 1.25, 'colour': r'#a7d9b0', 'dx': 0.141,
                       'coil_length': 0.3, 'coil_width':0.9, 'coil_edge': 0.3, 'coil_dx': -0.141},
            'MBNV': {'width': 0.6, 'height': 1.1, 'colour': r'#f29010', 'coil_length': 0.22, 'coil_width': 0.6, 'coil_height': 0.64},
            'MBNH': {'width': 1.1, 'height': 0.6, 'colour': r'#f29010', 'coil_length': 0.22, 'coil_width': 0.64}, 'coil_height': 0.6,
            'MBW' : {'width': 0.88, 'height': 0.47, 'colour': r'#d4340c', 'coil_length': 0.1, 'coil_width': 0.5},
            'MCWH' : {'width': 0.85, 'height': 1.0, 'colour': r'#a7d9b0', 'coil_length': 0.2, 'coil_width': 0.6},
            'MCWV': {'width': 1.0, 'height': 0.85, 'colour': r'#a7d9b0', 'coil_length': 0.2, 'coil_width': 0.6},
            'QNL' : {'width': 0.6, 'height': 0.8, 'colour': r'#fcd34c'},
            'QPL' : {'width': 1.1, 'height': 1.1, 'colour': r'#1e84eb', 'coil_length': 0.23, 'coil_width': 0.8, 'coil_height': 0.8},
            'QSL' : {'width': 0.32, 'height': 0.52},
            'QTS' : {'width': 0.6, 'height': 0.8, 'colour': r'#82bdb9'},
            'QWL' : {'width': 0.66, 'height': 0.84, 'colour': r'#d4340c', 'coil_length': 0.14, 'coil_width': 0.6},
            'LSX' : {'width':0.4, 'height':0.4, 'colour':r'#ddc8e9'},
            'XCHV' : {'style': 'fancy'}}
typeDict['MCB'] = dict(typeDict['MCA']) # copy it
typeDict['MBXGD'] = dict(typeDict['MCWV'])

h6 = pymadx.Data.Tfs("h6-survey.tfs")
maskRanges = [[9.2, 20.1]]
h8 = pymadx.Data.Tfs("h8-survey.tfs")
p42 = pymadx.Data.Tfs("p42-survey.tfs")

f1, ax1 = pymadx.Diagrams.Survey2DZX(h6, typeDict=typeDict, elementDict=elemDict, pipeRadius=0.07, pipeMaskRanges=maskRanges)
pymadx.Diagrams.Survey2DZX(h8, ax=ax1, typeDict=typeDict)
pymadx.Diagrams.Survey2DZX(p42, ax=ax1, typeDict=typeDict)

f2, ax2 = pymadx.Diagrams.Survey2DZY(h6, typeDict=typeDict, elementDict=elemDict, pipeRadius=0.07, pipeMaskRanges=maskRanges)
pymadx.Diagrams.Survey2DZY(h8, ax=ax2, typeDict=typeDict)
pymadx.Diagrams.Survey2DZY(p42, ax=ax2, typeDict=typeDict)
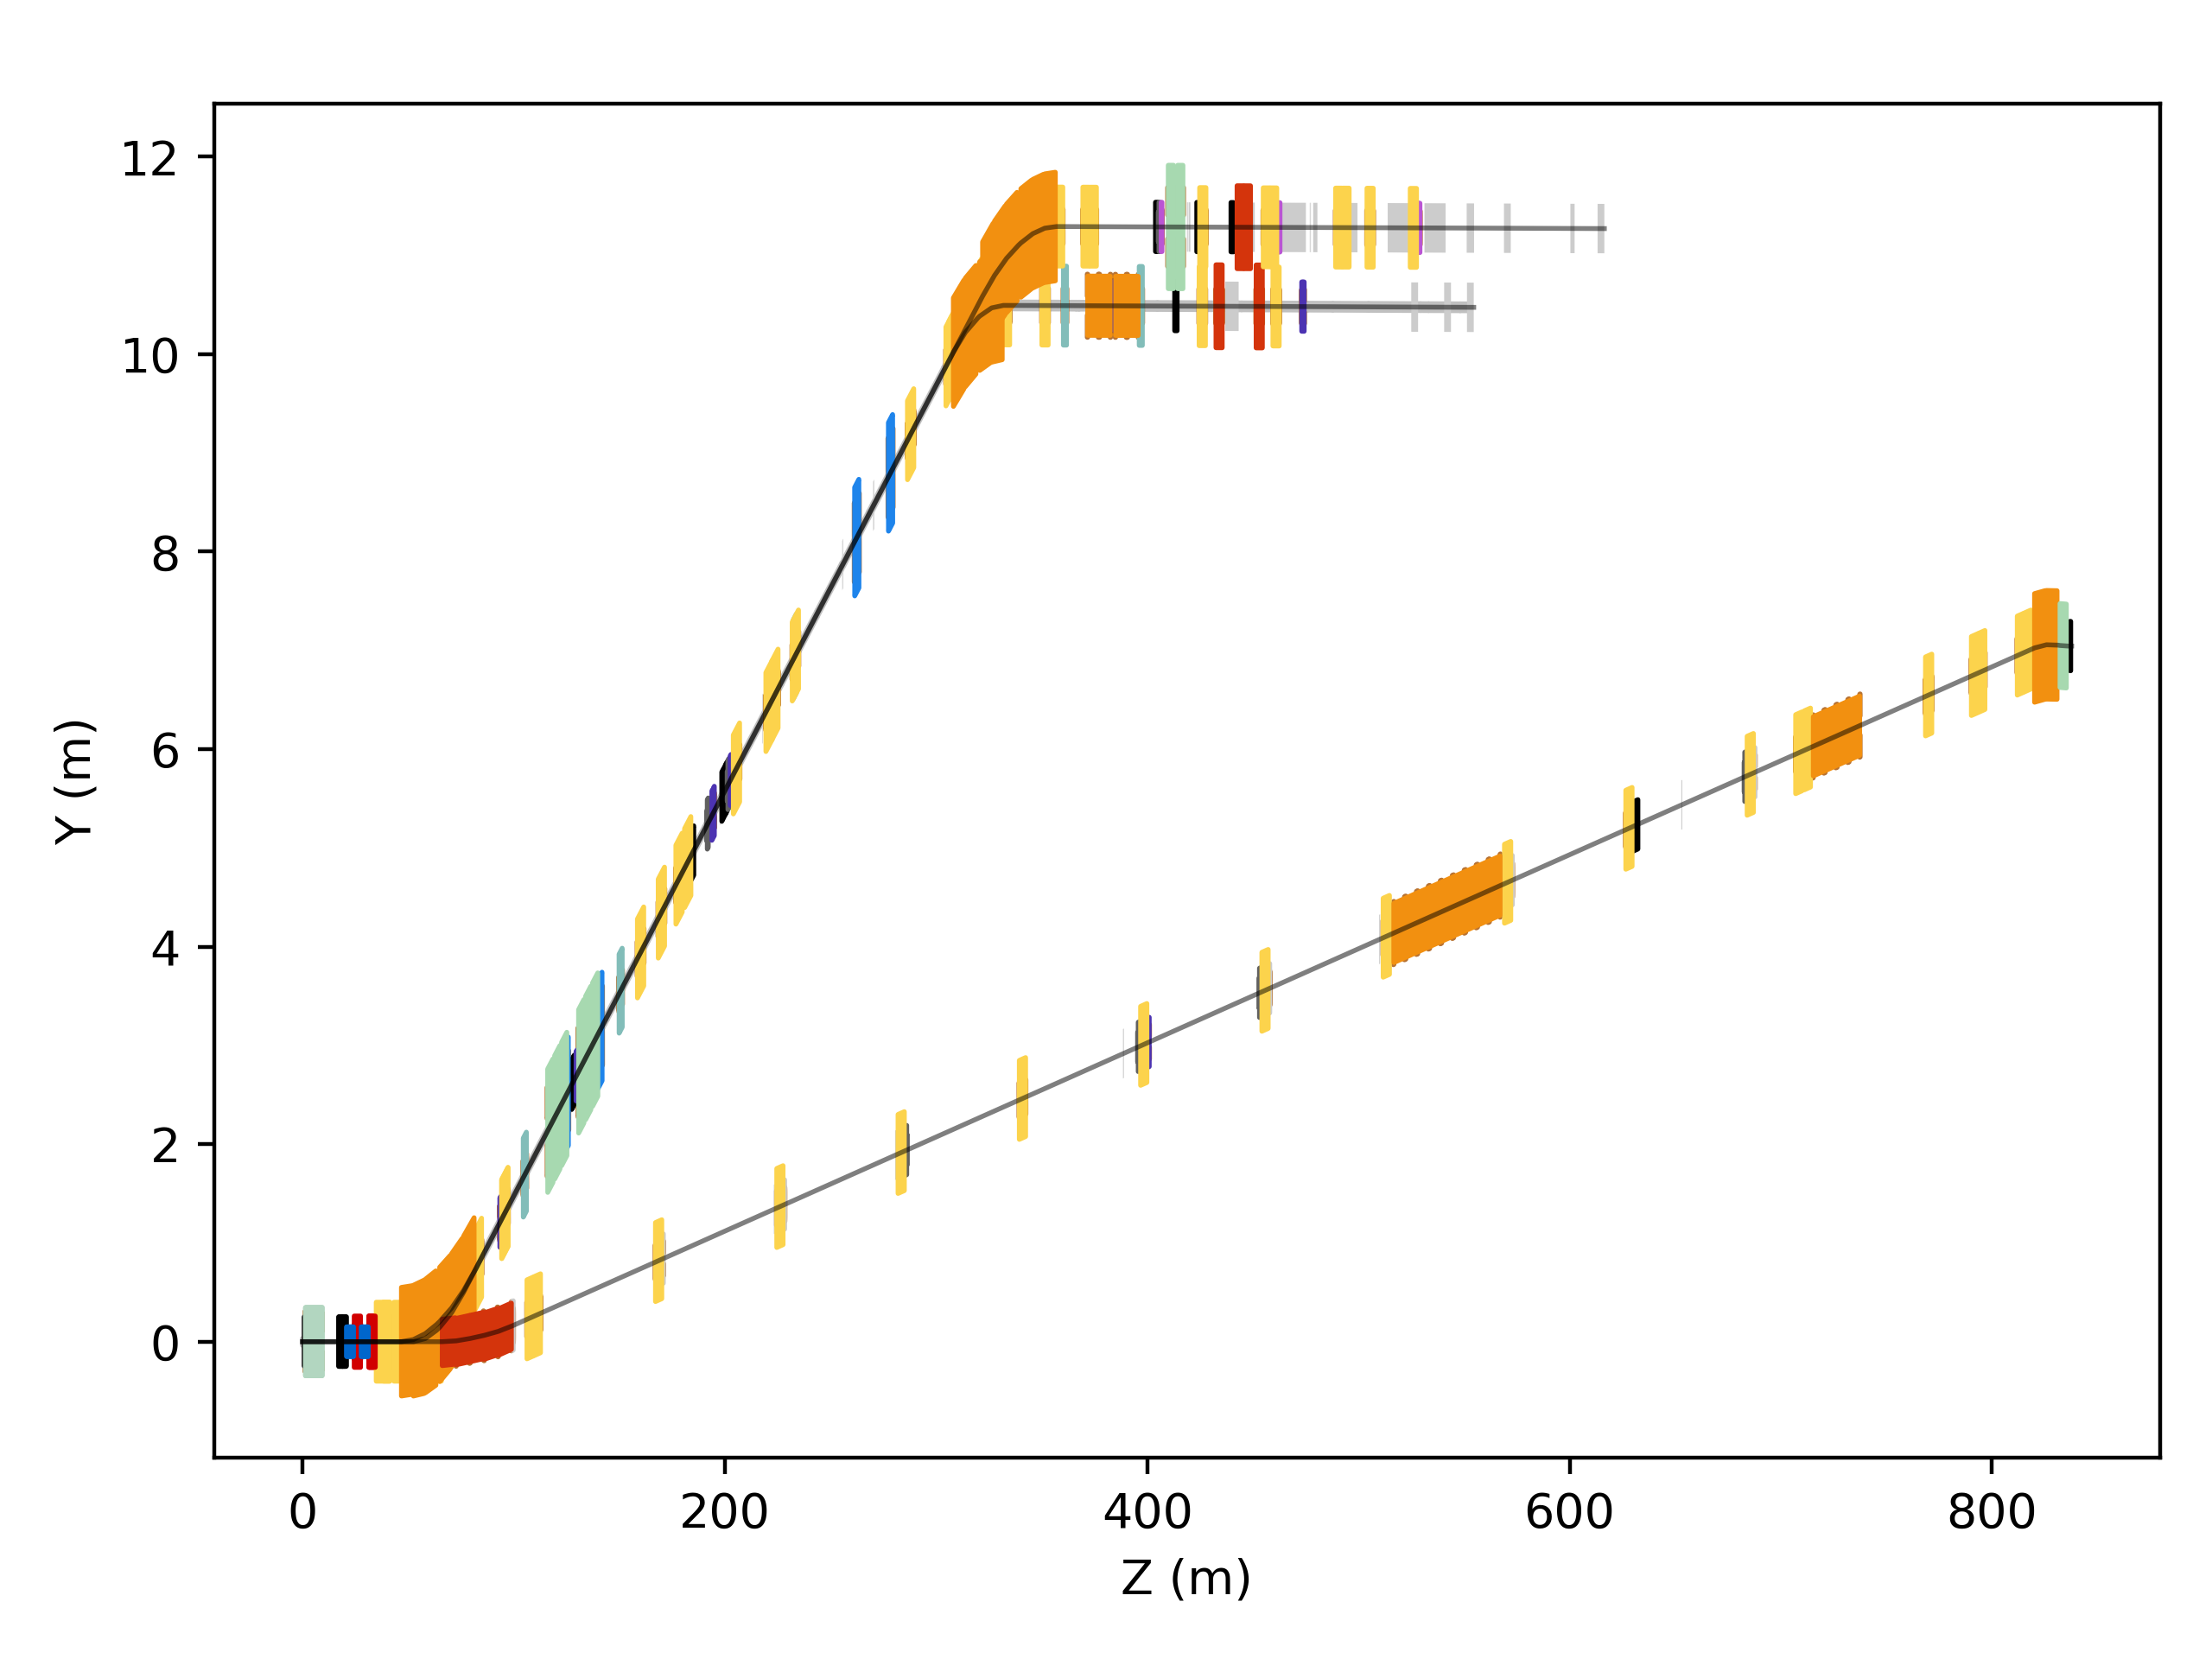
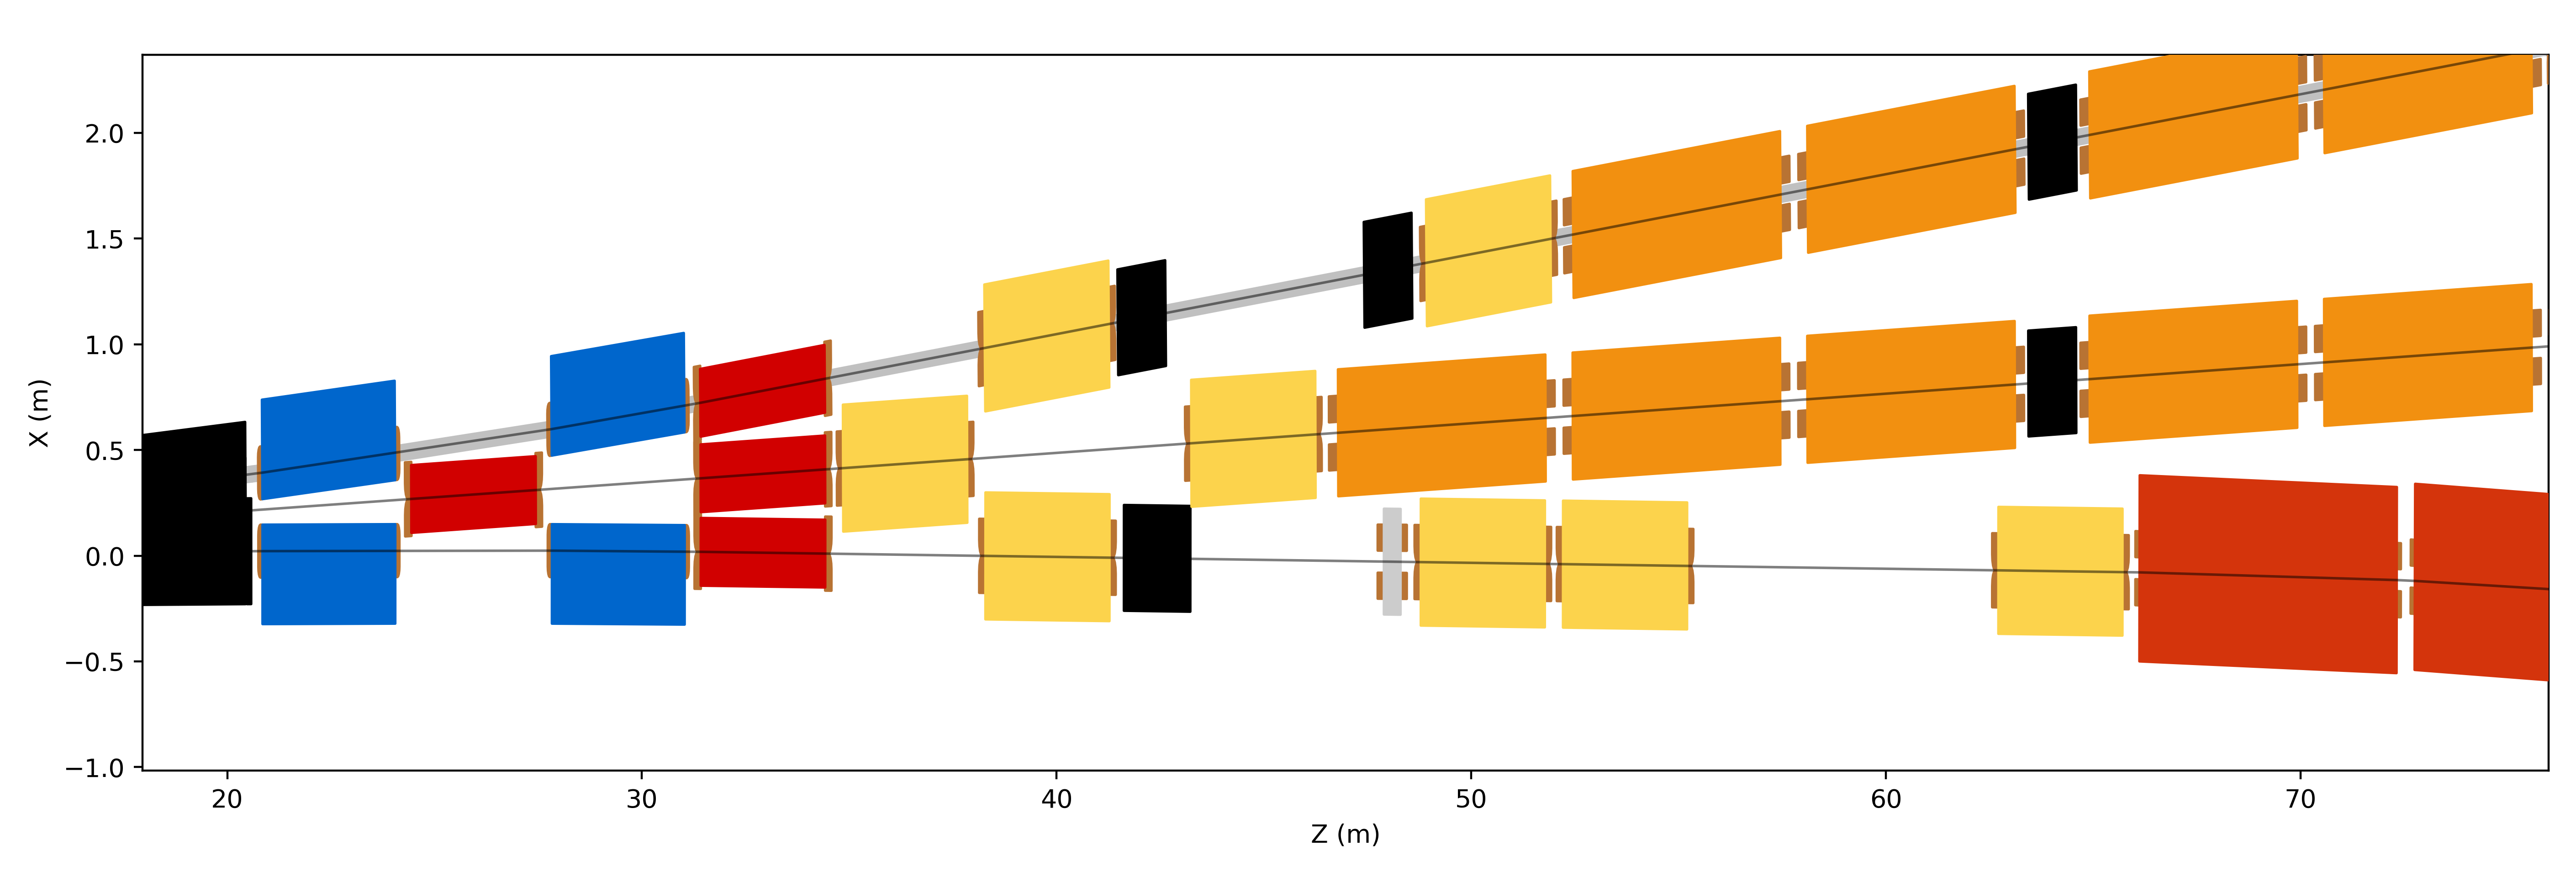
This example produces the following diagrams.
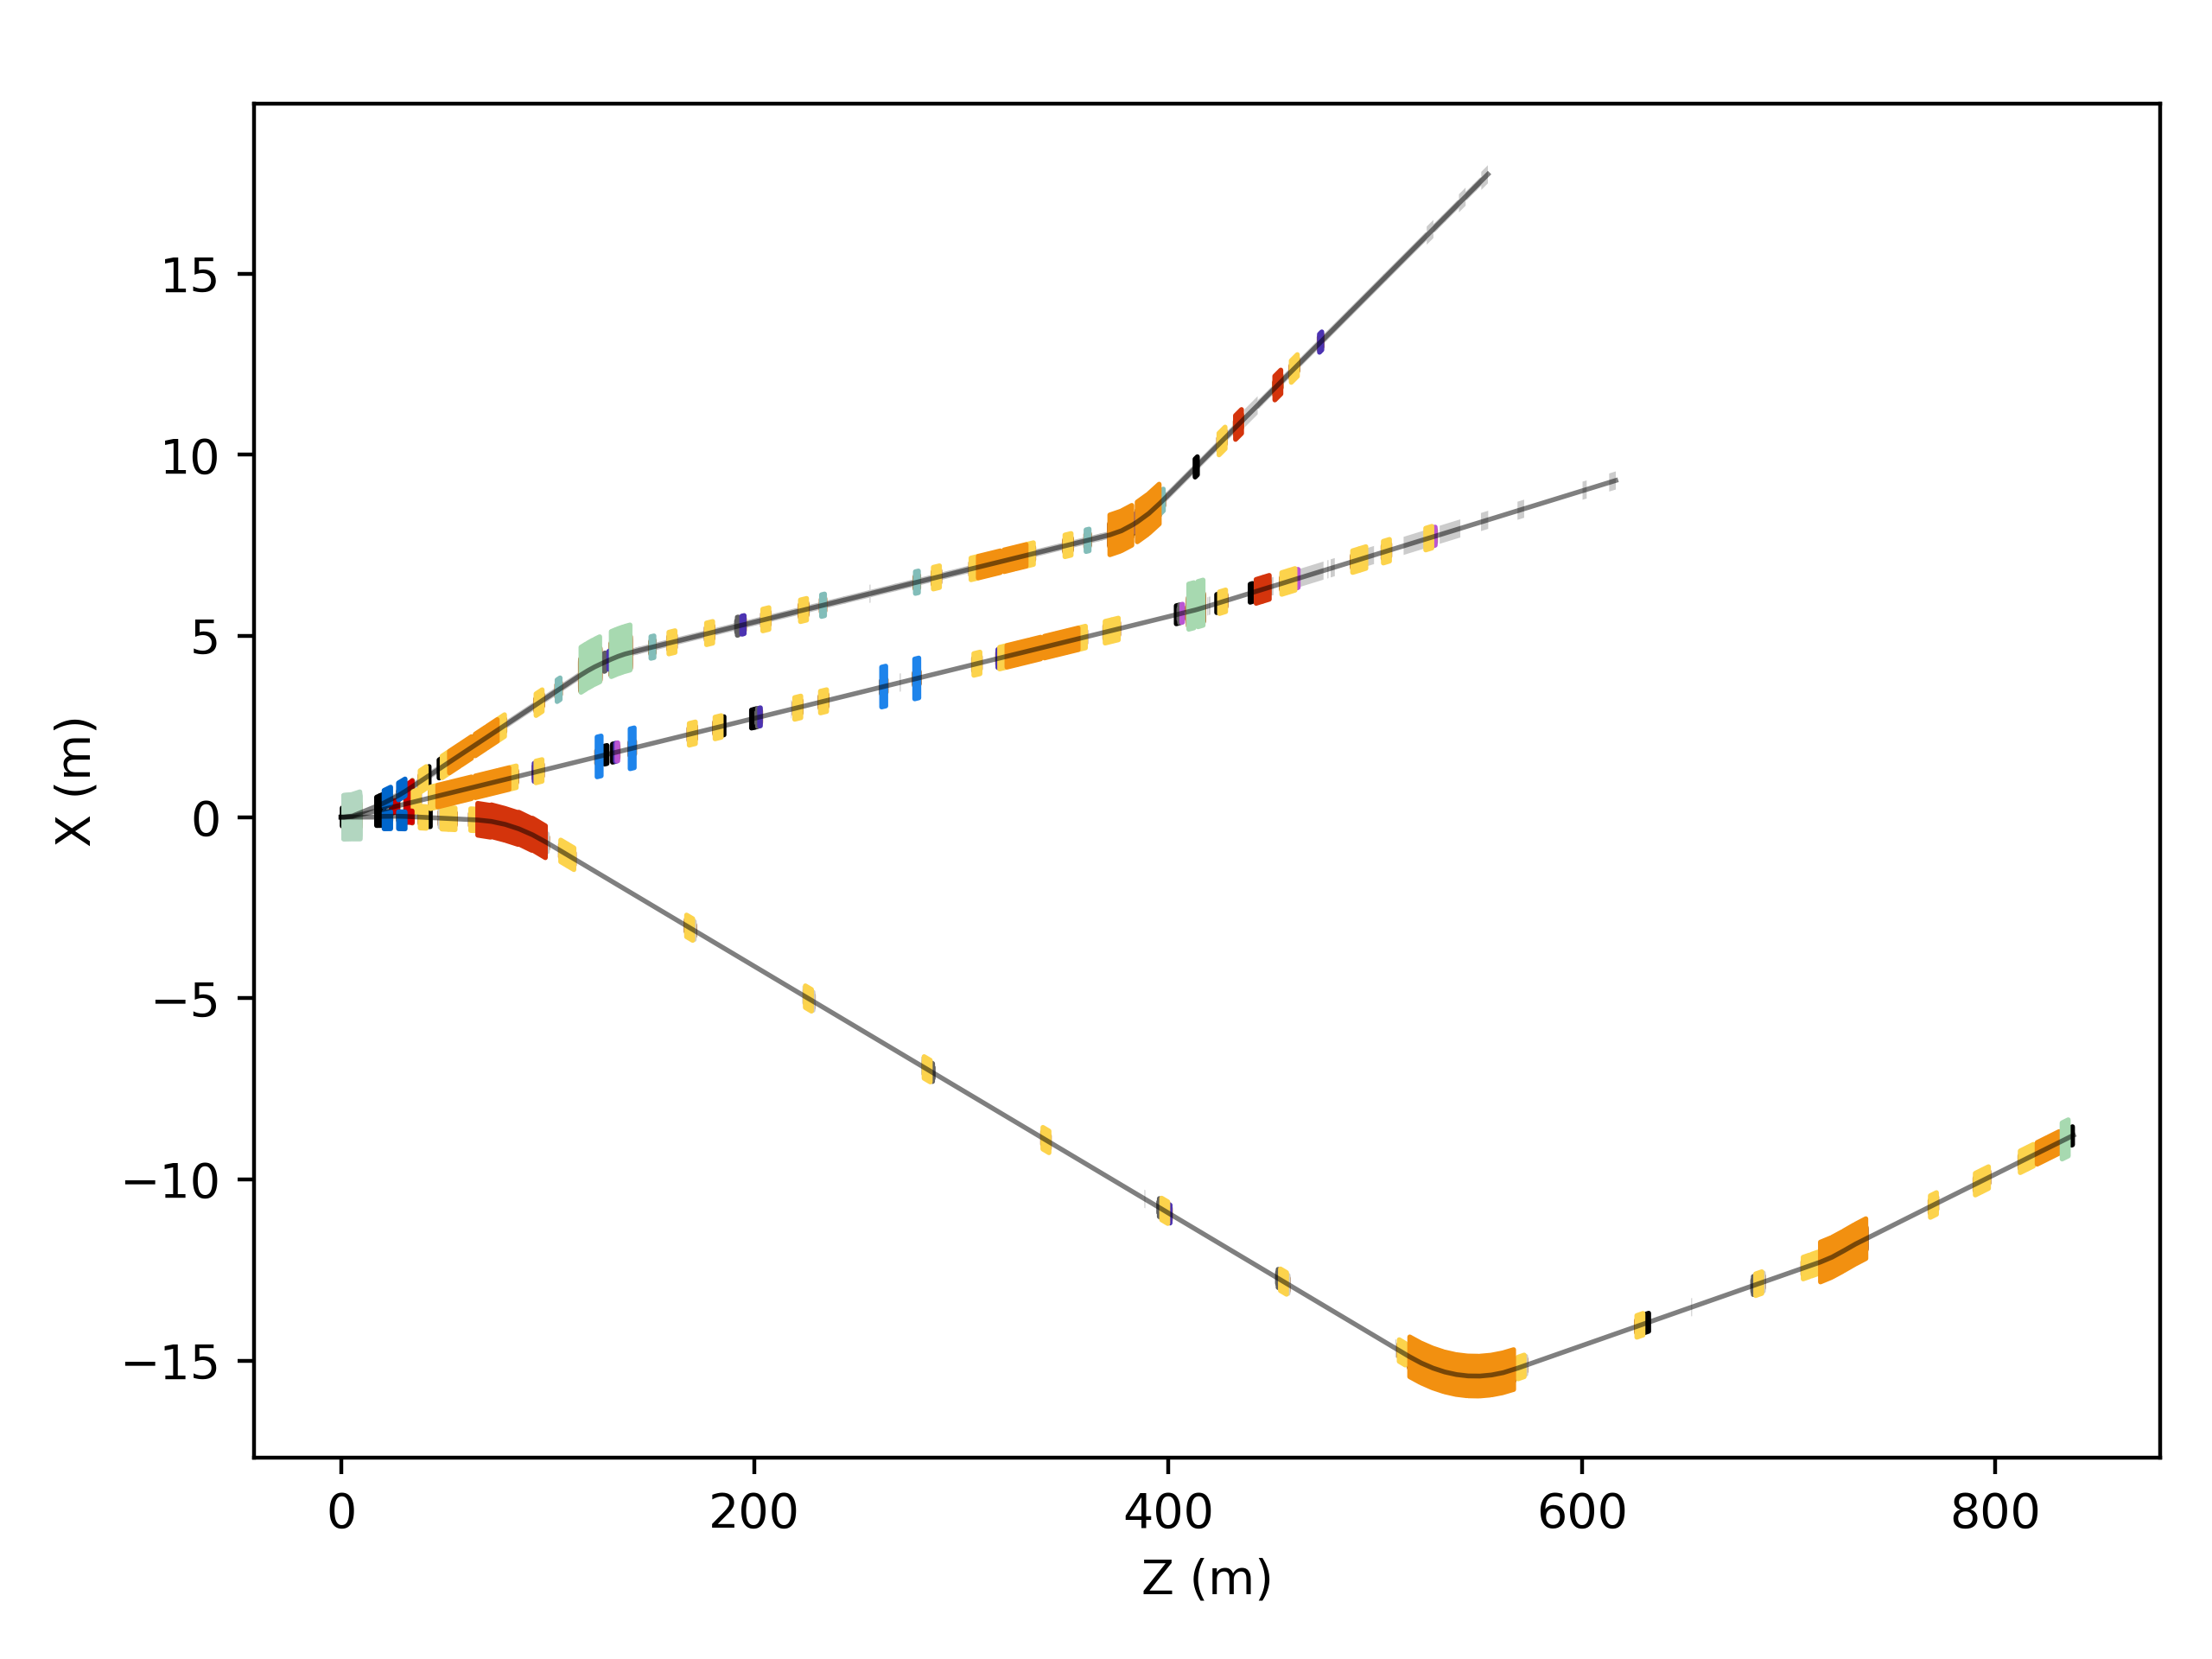
Beamlines H6, H8 and P42 at CERN shown overlapped with customisation.
Beamlines H6, H8 and P42 at CERN shown overlapped with customisation.
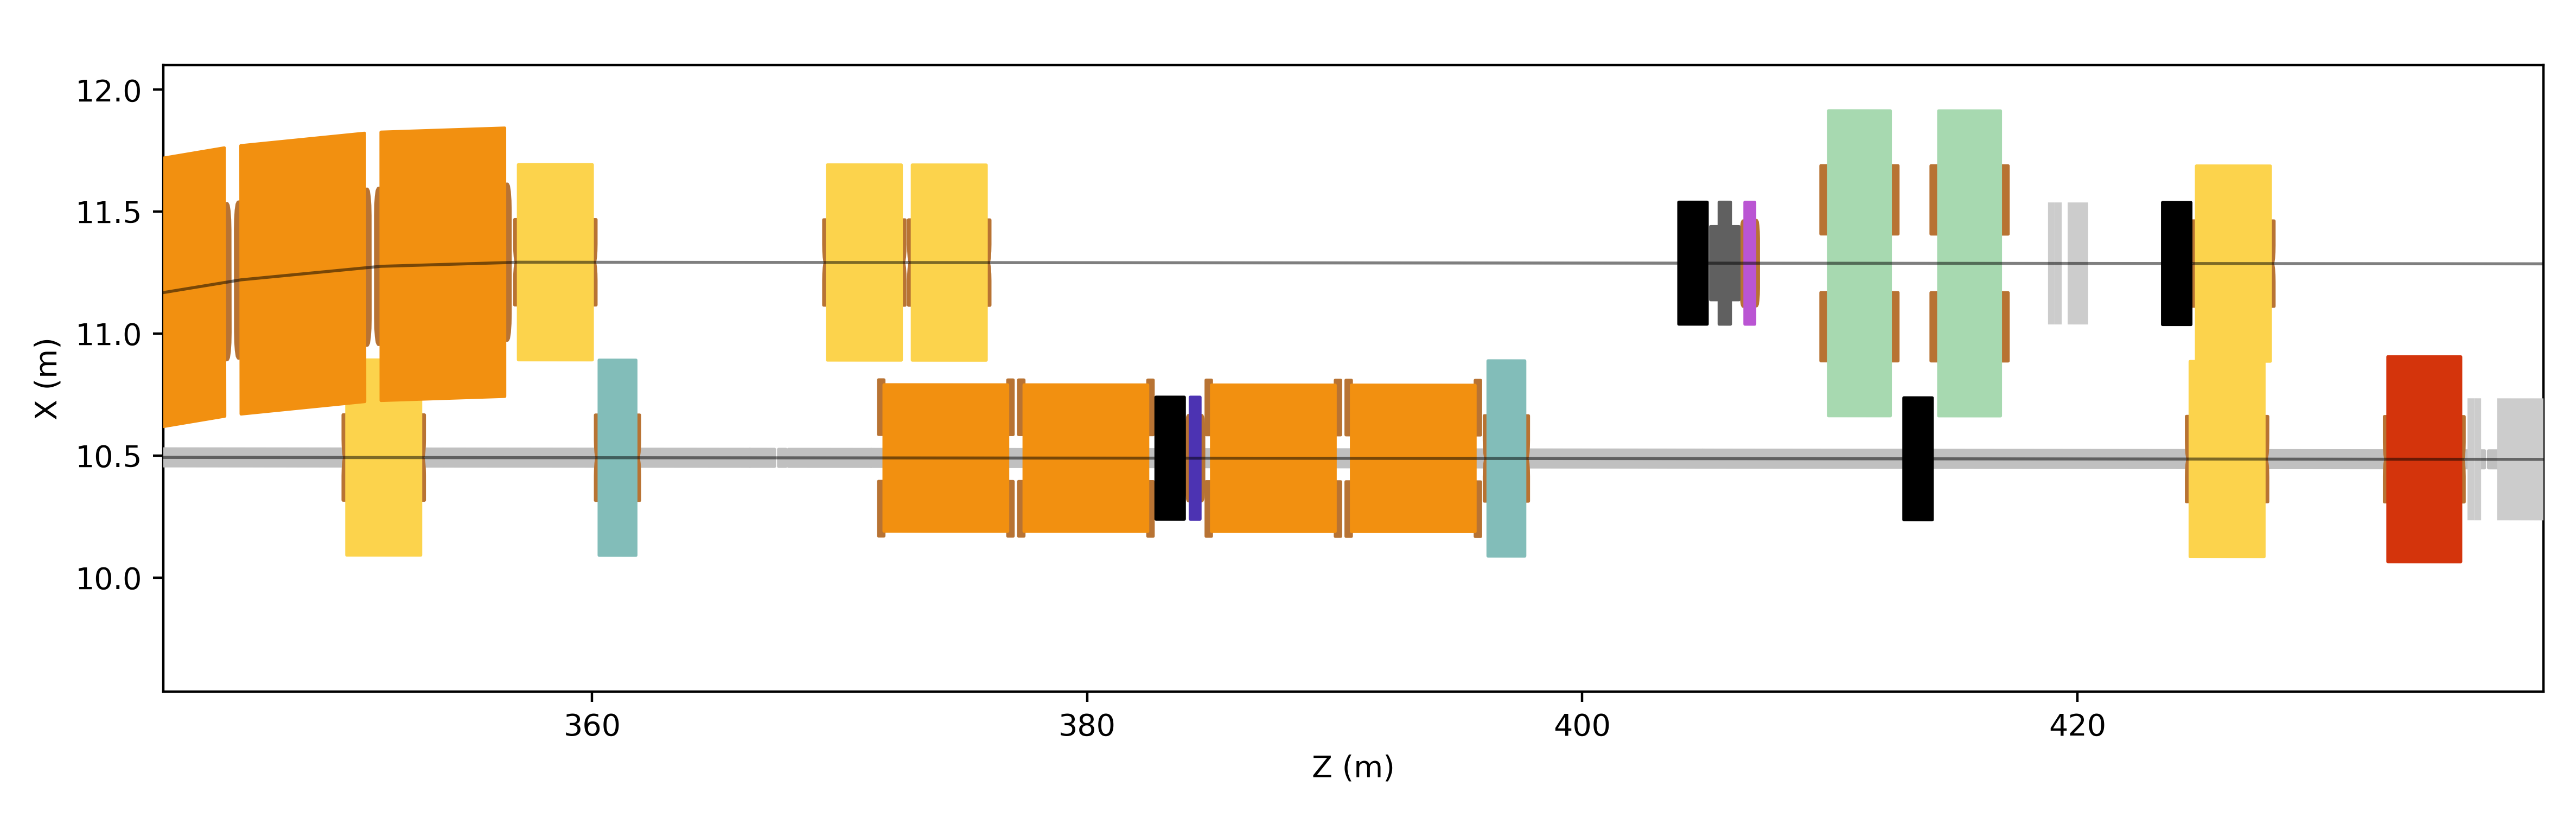
And zooming in, we can see the detail in the coils.
Beamlines H6, H8 and P42 at CERN shown overlapped with customisation.
Beamlines H6, H8 at CERN shown overlapped with customisation.