In this section, you will learn how to use external software packages to create and plot histograms and draw simple graphs. You will also get some experience of putting together a larger software project from several components. This is a little different from the previous sections, because you are expected to find out for yourself, from documentation and examples, how to use the software you are given.
Exercise 9.1
Follow the instructions below to produce the programs described, which
you should demonstrate with answers, listings, output and plots in
your lab book.
Computer-generated random numbers are not truely random. This is because the computer can only carry out instructions, so the outcome is always predictable. However, it can give the appearance of randomness by using an algorithm which generates a sequence of numbers which behave very much like random numbers. Because the sequence has been calculated, it is reproducible. In fact, if you run your program several times with the same seed15 it should always give the same sequence of `random' numbers. For this reason they are known as pseudo-random numbers.
Java provides a pseudo-random number generator in the java.util package,
documented here:
http://download.oracle.com/javase/6/docs/api/java/util/Random.html
This documentation explains the interface of the Random class in great detail: its constructors, methods and class variables. It is in a standard style of documentation for java, known as ``javadoc''. You may find it quite confusing at first but it is useful for reference so you should try to get used to it. However, all you need to know to use the Random class for this exercise is explained below.
Note that many of the explanations in the documentation contain code to show you how some methods are implemented. You do not have to write this code to use the Random class.
To use it, first you will need to put an import statement at the top of your program:
import java.util.Random;
You should create an object of class Random, using one of its constructors, e.g.
Random r = new Random();
or, with a seed,
    long seed = 1220645228; // change this for a different sequence
    Random r = new Random(seed);
Then you can call the methods of this object to get random numbers as required, e.g. nextDouble() and nextGaussian(). These are listed in the documentation.
Write a program to generate 100 random numbers with a distribution that is:
The concept of a histogram is explained in Appendix D.
A Histogram class is provided for you to use. It is documented here:
http://www.pp.rhul.ac.uk/~george/PH2150/jdocs/.
To use the Histogram class, you need to download it from here:
http://www.pp.rhul.ac.uk/~george/PH2150/downloads/Histogram.java
There is also a test program in which a a Histogram object is created
and used:
http://www.pp.rhul.ac.uk/~george/PH2150/downloads/HistogramTest.java
Copy the Histogram class from the web site and find out how to use it by looking at the documentation and the HistogramTest program.
Then, adapt your random number program from above to fill the generated random numbers into histograms. Use different histograms for the uniform and Gaussian distributed random numbers.
Add a method to the Histogram class which calculates the standard deviation of the histogram. The standard deviation is defined as:
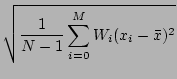
where in this case, M is the number of bins, ![]() is the mean
of the histogram, for which a method is already provided, xi
is the central value of bin i and Wi is the height of the bin,
which is used to weight the sum. N is the number of entries made
into the histogram, not including over/underflows. Use this
method to print the standard deviation of your Histogram
objects.
is the mean
of the histogram, for which a method is already provided, xi
is the central value of bin i and Wi is the height of the bin,
which is used to weight the sum. N is the number of entries made
into the histogram, not including over/underflows. Use this
method to print the standard deviation of your Histogram
objects.
The next step is to display your histograms graphically. To draw graphs you will use the PtPlot package which is freely available [6]. This is already installed on the network so you just have to know how to use it.
In order to make it easier to use, a class SimplePlot is provided for you. There are methods to plot a curve (drawCurve) and a histogram (drawHistogram).
To use the SimplePlot class, you need to download it from here:
http://www.pp.rhul.ac.uk/~george/PH2150/downloads/SimplePlot.java.
The SimplePlot class is documented here:
http://www.pp.rhul.ac.uk/~george/PH2150/jdocs/.
There is also a test program in which a a SimplePlot object is created
and used:
http://www.pp.rhul.ac.uk/~george/PH2150/downloads/SimplePlotTest.java
Look at the SimplePlot class, documentation and example (the example is the best place to start). Using the instructions in the next section, try to compile and run the SimplePlotTest class. It should produce three graphs: a curve, a scatter plot and a histogram. Look at the code of SimplePlotTest to understand how to do this. Then use a SimplePlot object in your program to display the histogram.
Documentation for the PtPlot package is available here:
http://ptolemy.eecs.berkeley.edu/java/ptplot5.3/ptolemy/plot/doc/index.htm.
To compile and run Java programs which use an external package, you need to provide some extra information when you give the compile and run commands. Note that these will only work in a MSDOS command window, not in the Jext console.
First you need to know where the external package is. For convenience, this location can be assigned to a MSDOS environment variable. It is recommended that you set PTII to the location of the PtPlot package:
set PTII=P:\Applications\Ptolemy\ptplot5.3You can now refer to this location in java and javac commands by writing %PTII%.
To compile a program that uses some external package, you have to tell the compiler where to find this package, using the -classpath option, i.e.
javac -classpath %PTII%;. MyClass.javaNote that `;.' must be at the end of the classpath. This tells the compiler to continue looking in your current folder for files as well.
You only need to compile your class with the main method. The Java compiler will automatically work out which other classes need to be compiled for you and do this.
To run your program, you must again specify the classpath, i.e.
java -classpath %PTII%;. MyClass
Your program should now create and plot random number distributions. You can use this to investigate the central limit theorem.
Modify your program to make and plot histograms of the following:
Compare the mean and standard deviation of these histograms to those of the Gaussian you made earlier. Also compare the shapes you see in the graphical plots. What do you notice as the number of random numbers added together increases? What do you expect to happen as it approaches infinity?
This demonstrates the central limit theorem, which is explained further in many statistics books, such as [5].