MSci Skills
PH3010 Project Information
2010/2011

MSci Skills
PH3010 Project Information
2010/2011 |
|
Your project is to simulate the properties of x-rays produced via synchrotron radiation by writing a Monte Carlo computer program; there exists a project script here. You can also use the partial code for the FunctionFromTable class: FunctionFromTable_partial.java, and the histogram class Histogram.java.
The website for the postgraduate/MSci course on Computing and Statistical Data Analysis contains a lot of information relevant to your project. In particular, look at Statistics Lectures 1 through 5 (especially lecture 5 on the Monte Carlo method). Many of the links on the page are also useful for this project.
A simple C++ program that generates random numbers is given at the bottom of the page on Computer Routines from the book Statistical Data Analysis. You can easily convert this into a java routine.
This project allows a brief introduction to the use of the Physics Department's 10-inch Schmidt-Cassegrain telescope and two of our CCD cameras. Here is a still evolving script for the project in ps or pdf formats.
Here is a New Users Guide to the RHUL Observatory. You should read through this before you begin working with the telescope.
It is recommended to do first the project above, Introduction to observational astronomy, before attempting the solar limb darkening project. The script is available in ps or pdf formats.
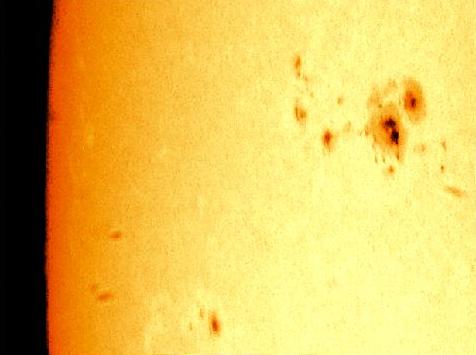
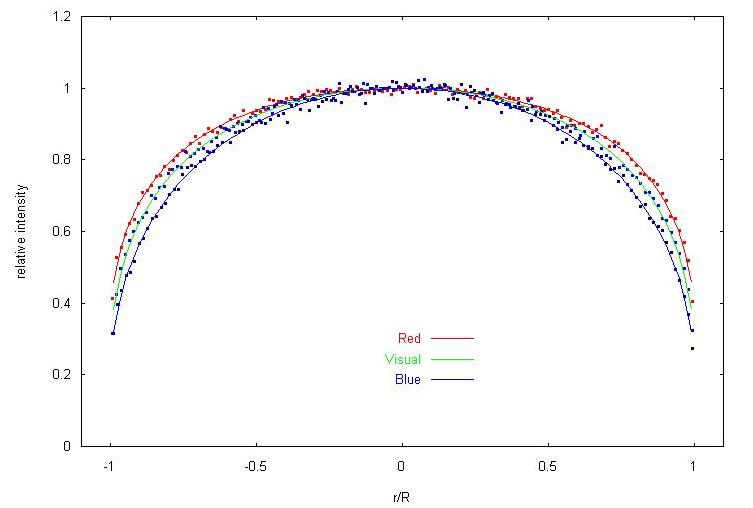
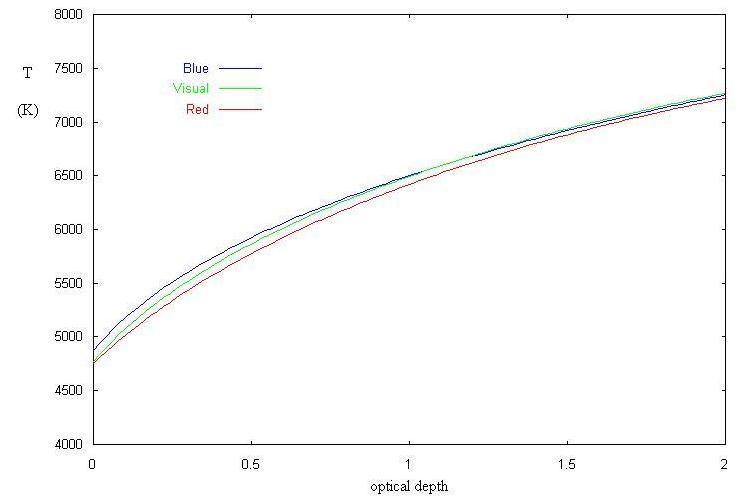
The project involves measurement and analysis of solar limb darkening, i.e., the effect where the sun's edge (limb) appears darker than the centre of the disc. This can be seen easily in this photo of the solar limb taken by Bevan Scott for his 3rd year project. Using the QuickCam CCD and LX-200, Graham Kilvington and I measured the intensity as a function of position on the sun's disc using Schuler B, V and R filters; the limb darkening effect is more pronounced for shorter wavelengths. The fitted curves can be used to determine the source function, which in turn can be used to find the temperature of the sun as a function of the optical depth.
The software tools for this project are in a constant state of evolution. Please consult with me about this. A lot of the ingredients can be found in the directory here, including this short description of the software you will need.
For practice purposes, or if it proves impossible because of weather problems to obtain new data, we can look at the data set from 19 July 2002, which can be found here (see the file notes_19_7_02.txt for info about the data).
For the data analysis you may have to estimate the point-to-point variation in intensity from a run where you track a particular position on the sun, say, near the centre. Here is a note on how to do this using the method of least squares: ps or pdf.
Once you have the measured intensities extracted into a text file, you can make plots and also do least-squares fitting with the program gnuplot. Here is a brief gnuplot tutorial by Henri Gavin, and here is a nice gnuplot site by Kawano.
Another possibility for the data analysis is to modify the following sample mathematica notebook called linear_fit.nb, which reads in columns of (x,y) data from a file and performs a least squares fit of a polynomial. And here is another one called nonlinear_fit.nb, which reads in columns of (x,y, dy) data from another file and does a nonlinear fit.
Here are some useful links: