Data Loading
Utilities to load BDSIM output data. This is intended for optical function plotting and small scale data extraction - not general analysis of BDSIM output.
Loading ROOT Data
pybdsim can load several different ROOT files produce by BDSIM, rebdsim, rebdsimCombine, bdskim, rebdsimOptics, rebdsimHistoMerge. In all cases, the same function is used but it may return a different pybdsim class representing the loaded data.
>>> d = pybdsim.Data.Load("mylovelyfile.root")
In the case of a rebdsim file, an instance of the pybdsim.Data.RebdsimFile class is returned (See RebdsimFile). In the case of a raw BDSIM output file, an instance of the BDSIM DataLoader analysis class is returned (even in Python).
Note
To load BDSIM raw data, the <bdsim-install-dir>/bin/bdsim.sh script
must be sourced. This sets up environmental variables that ROOT requires to
load our shared libraries in C++ with definitions of the layout of the files
(i.e. the C++ classes). See also, Manually Loading Raw Data for a method to
load the libraries yourself (normally automatic with Load()).
Load Just Histograms
It may be useful to load just the histograms on a computer with ROOT and pybdsim but without BDSIM and all the libraries. In this case, we can use the RebdsimFile class directly and flag that we should not try to load the BDSIM libraries. In this case, it can only interpret native ROOT objects such as histograms and not the other data in the file such as the beam line model (for plotting machine diagrams).
>>> import pybdsim
>>> d = pybdsim.Data.RebdsimFile("sample1.root", histogramsOnly=True)
>>> d.histogramspy
{'Event/PerEntryHistograms/PrimaryX': <pybdsim.Data.TH1 at 0x1549cef40>,
'Event/PerEntryHistograms/EventDuration': <pybdsim.Data.TH1 at 0x1549d1040>,
'Event/PerEntryHistograms/EnergySpectrum': <pybdsim.Data.TH1 at 0x1549e0df0>,
'Event/PerEntryHistograms/EnergyLossManual': <pybdsim.Data.TH1 at 0x15503adc0>,
'Event/PerEntryHistograms/TunnelLossManual': <pybdsim.Data.TH1 at 0x15503adf0>,
'Event/PerEntryHistograms/AperImpactXInRange': <pybdsim.Data.TH1 at 0x15503ae20>,
'Event/SimpleHistograms/PrimaryYSimple': <pybdsim.Data.TH1 at 0x15503ae50>,
'Event/MergedHistograms/PhitsHisto': <pybdsim.Data.TH1 at 0x15503ae80>,
'Event/MergedHistograms/PlossHisto': <pybdsim.Data.TH1 at 0x15503aeb0>,
'Event/MergedHistograms/ElossHisto': <pybdsim.Data.TH1 at 0x15503aee0>,
'Event/MergedHistograms/PhitsPEHisto': <pybdsim.Data.TH1 at 0x15503af10>,
'Event/MergedHistograms/PlossPEHisto': <pybdsim.Data.TH1 at 0x15503af40>,
'Event/MergedHistograms/ElossPEHisto': <pybdsim.Data.TH1 at 0x15503af70>,
'Event/MergedHistograms/PFirstAIHisto': <pybdsim.Data.TH1 at 0x15503afa0>,
'Event/MergedHistograms/ElossTunnelHisto': <pybdsim.Data.TH1 at 0x15503afd0>,
'Event/MergedHistograms/ElossTunnelPEHisto': <pybdsim.Data.TH1 at 0x15503ad90>,
'Event/PerEntryHistograms/PrimaryXY': <pybdsim.Data.TH2 at 0x155043040>,
'Event/SimpleHistograms/PrimaryXYSimple': <pybdsim.Data.TH2 at 0x1550430a0>,
'Event/PerEntryHistograms/D2XYEnergy': <pybdsim.Data.TH3 at 0x1550430d0>}
Looping Over Raw ROOT Data
We can loop over the raw BDSIM data easily with pybdsim.
d = pybdsim.Data.Load("run1.root")
eventTree = d.GetEventTree()

for event in eventTree:
    # now we have event.<branchname>.<variable>
    print(event.Eloss.n)
We can also get an index with enumeration:
for i,event in eventTree:
    print(i, event.Eloss.n)
RebdsimFile
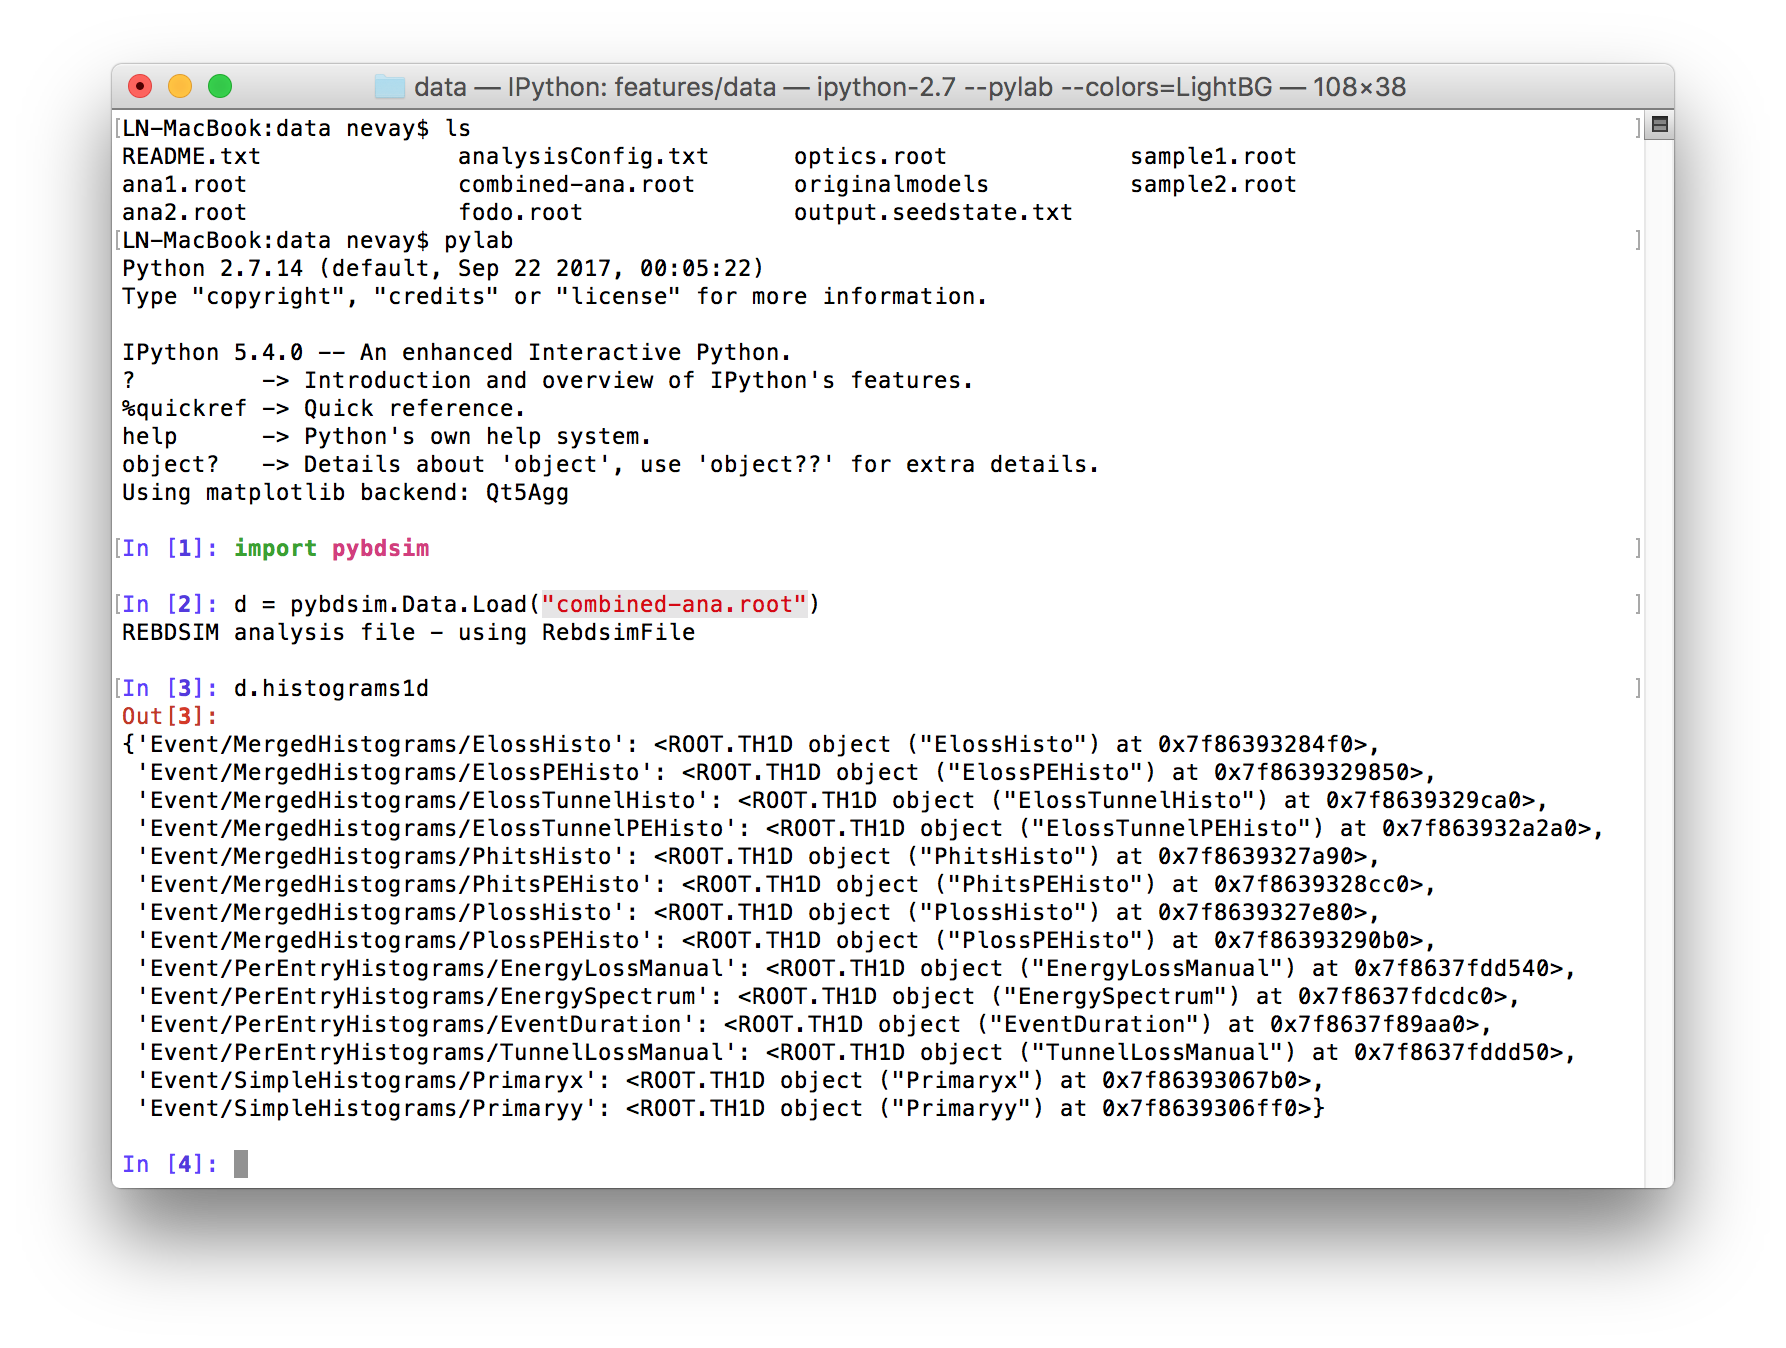
When a rebdsim output file is loaded, all histograms will be loaded into a dictionary with their path inside the root file (i.e. in various folders) as a key. All histograms are held in a member dictionary called histograms. Copies are also provided in histograms1d, histograms2d and histograms3d.
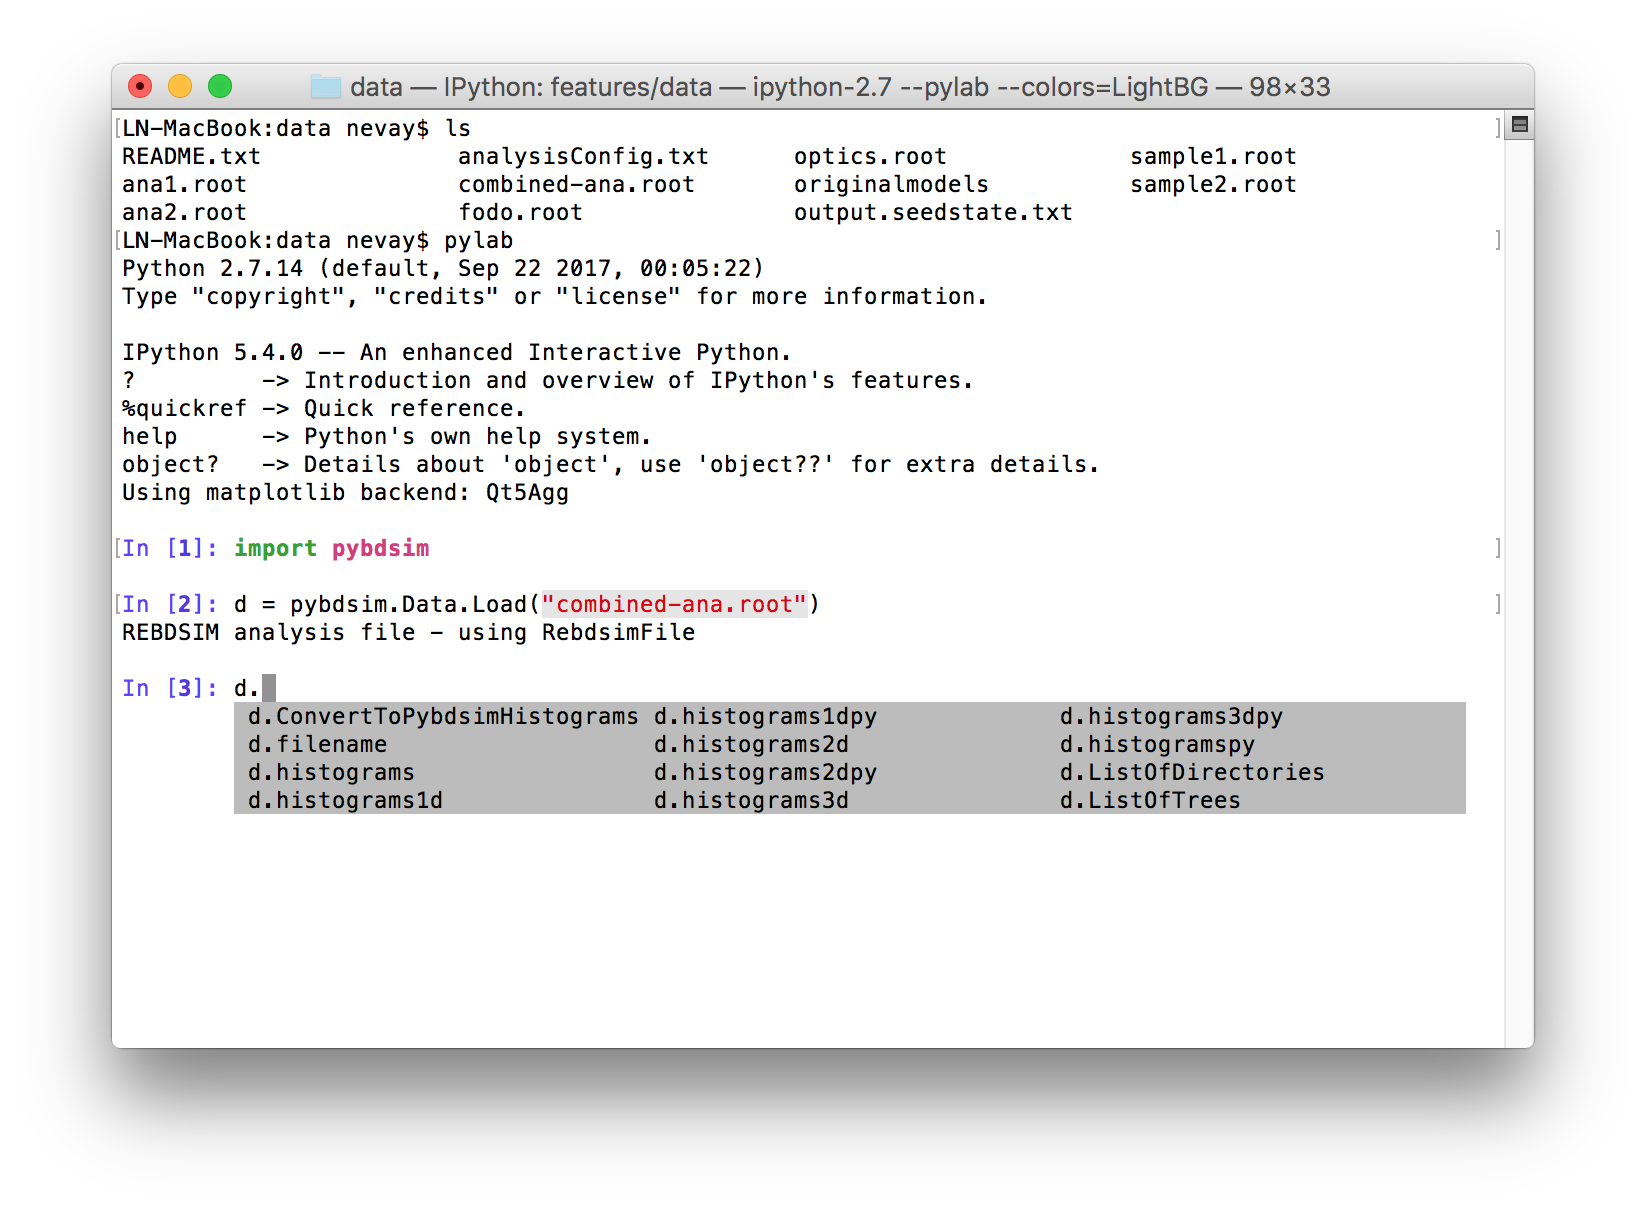
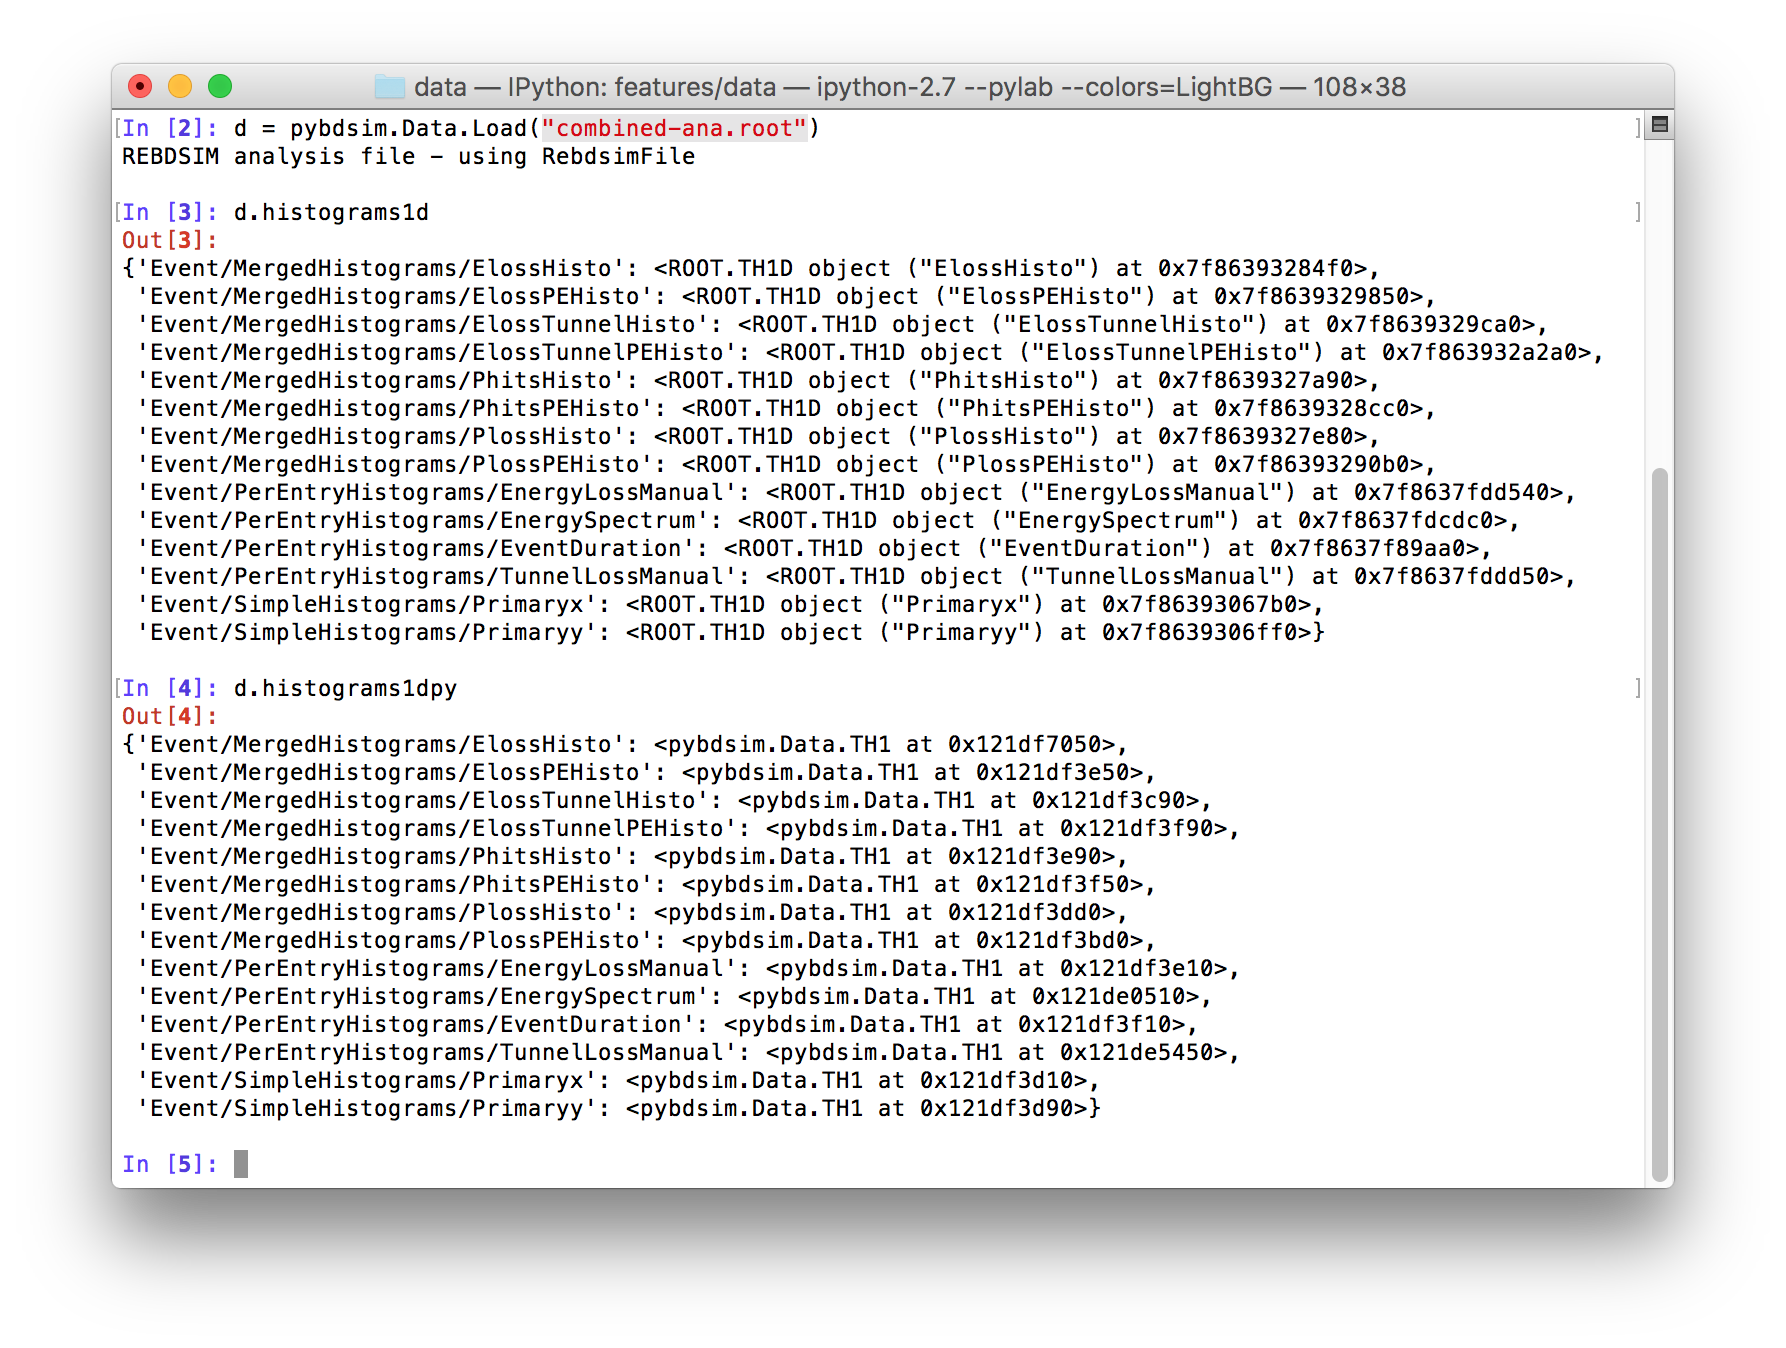
For convenience we provide wrappers for the raw ROOT histogram classes that provide easy access to the data in numpy format with simple matplotlib plotting called pybdsim.Data.TH1, TH2 and TH3. Shown below is loading of the example output file combined-ana.root in bdsim/examples/features/data.
Skimming Data With Custom Filter
The compiled tool bdskim exists to select a subset of events from a BDSIM
raw output file. It produces another BDSIM raw output file but with fewer events
that pass a selection (like a selection used for a histogram). However, we may
want to make a more complex selection that simply isn’t possible in a single
histogram selection line.
In this case, we can use a little analysis written in Python and use pybdsim to help to ‘skim’ the file nicely for us. Below is an example:
import pybdsim
def MyCustomFilter(event):
    return 20.0 < event.Primary.energy[0] < 100.0
SkimBDSIMFile("originalData.root", MyCustomFilter)
This will apply MyCustomFilter, which returns True only when the first primary in the event has a total energy greater than 20.0 GeV and less than 100.0 GeV. Events matching this criteria will be saved to a new BDSIM raw file called “originaData_skim.root”.
Histogram Plotting
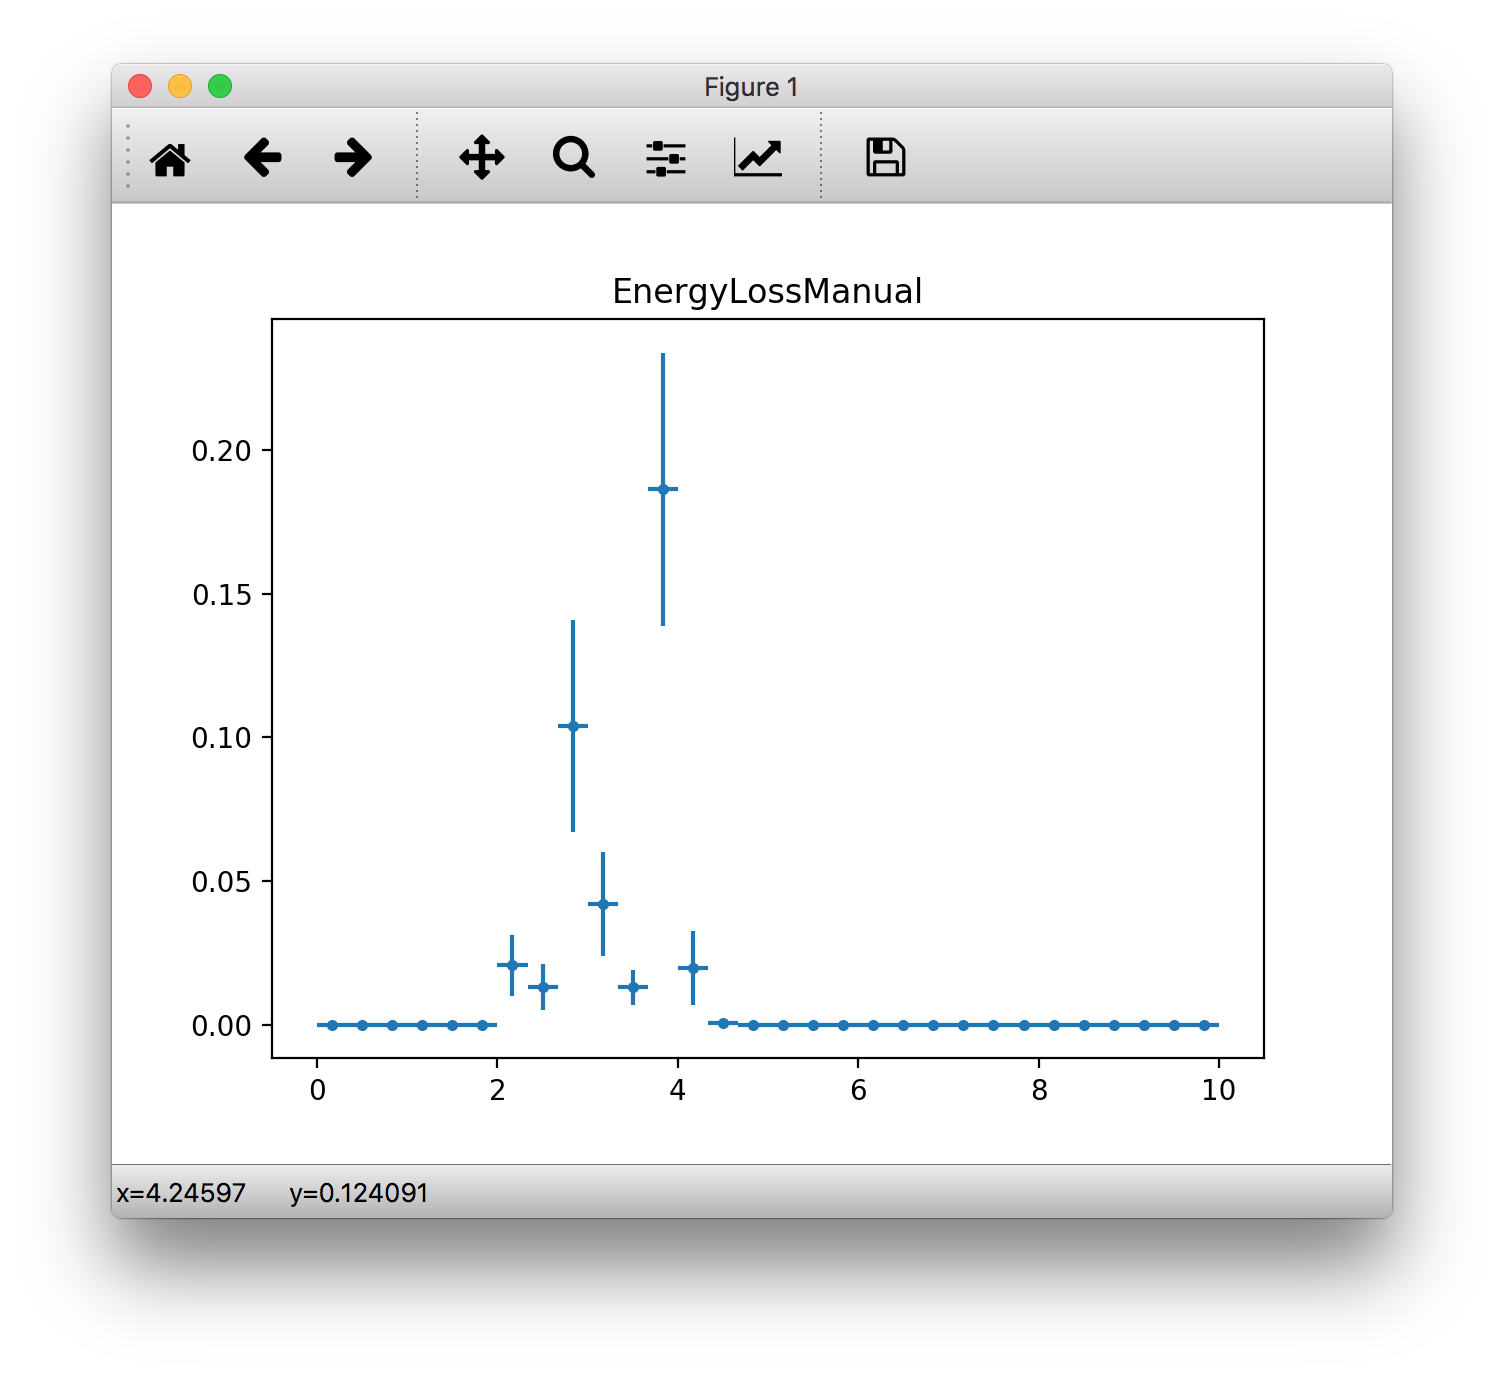
Loaded histograms that are wrapped in our pybdsim.Data.THX classes can be plotted:
>>> pybdsim.Plot.Histogram1D(d.histogramspy['Event/PerEntryHistograms/EnergyLossManual'])
Note, the use of d.histogramspy for the wrapped set of histograms and not the raw ROOT histograms.
ROOT Histogram Operations
Loaded histograms from a rebdsim file are both wrapped in our pybdsim.Data.THX classes for nice numpy arrays for easy plotting, but also we retain the original ROOT objects.
We can use the original ROOT objects to do many very useful things with the histogram, then wrap it again for plotting.
Get the ROOT histogram from the loaded file in pybdsim
Manipulate that ROOT object
Wrap it yourself in a pybdsim.Data.THX class
Plot using pybdsim.Plot.Histogram…
e.g.
>>> d = pybdsim.Data.Load("run1-ana.root") # a rebdsim output file
>>> h1 = d.histograms['Event'/PerEntryHistograms/EnergyLossBeamline']
>>> h1rebin = h1.Rebin(2, h1->GetName()+"_rebin2")
>>> h1rebinpy = pybdsim.Data.TH1(h1rebin)
>>> pybdsim.Plot.Histogram1D(h1rebinpy)
ROOT’s histograms provide many (many…) functions. You can see them all at the ROOT website (Look for “CERN ROOT TH1” in google) or TH2 or TH3:
TH1 is, perhaps nonintuitively, the base class for 2D and 3D histograms, so many functions are documented there. The 2D and 3D ones have some specialised methods.
Note
The integral and its error are nicely provided as members in pybdsim.Data.THXD. Also, you can use the pybdsim.Plot.Histogram… functions with a scaling parameter for the data.
Some useful functions assuming a histogram h of type TH1D or TH2D or TH3D in Python:
TH1
hnew = h.Rebin(N,h.GetName()+"_rebin"+str(N))Join N bins into 1. e.g. Rebin(2) is merge 2 bins into 1.h.Add(h2)Changeshby adding h2 to it.h.Add(h2, -1)Changeshby subtracting h2 from it.h.Divide(h2)Changehto h divided by h2.h.Multiply(h2)Changehto h times h2.h.Scale(number)Changehto multiply every bin by ‘number’.
TH2
hnew = h.Rebin2D(Nx, Ny, h.GetName()+"_rebin"+str(Nx)+str(Ny))Join Nx bins in x and Ny bins in y into 1.h.Scale(number)Changehto multiply every bin by ‘number’.h.ProjectionX(h.GetName()+"_int_x", 0, -1, "e")Integrate along the x dimension giving a 1D histogram in y.h.ProjectionY(h.GetName()+"_int_y", 0, -1, "e")Integrate along the y dimension giving a 1D histogram in y.
TH3
h.Scale(number)Changehto multiply every bin by ‘number’.h2d = h.Project3D("yxe")Integrate along z to give a TH2D x,y histogram and calculate errors (‘e’). https://root.cern.ch/doc/v608/classTH3.html#a94dd0a21d42fd95756e906e7f50fa293e.g. a 3D scoring mesh in x,y,z has N bins z = 1. We ‘project’ (i.e. integrate) in z given the same answer (only function available in ROOT) to get a 2D xy histogram. We want the errors to be calculated too rather than be 0.
>>> h3d_raw = d.histograms['Event/MergedHistograms/MyScoringMeshName']
>>> h2d = h3d_raw.Project3D("yxe")
>>> h2dpy = pybdsim.Data.TH2(h2d)
>>> pybdsim.Plot.Histogram2D(h2dphy)
h1d = h.ProjectionZ()Integrate x and y to give a 1D histogram in z.e.g. a 3D scoring mesh in x,y,z has only 1 bin in x and y, but N in Z. We use this function to reduce it to the 1D histogram it effectively is.
>>> h3d_raw = d.histograms['Event/MergedHistograms/PhantomDose']
>>> h1d = h3d_raw.ProjectionZ()
>>> h1py = pybdsim.Data.TH1(h1d)
>>> pybdsim.Plot.Histogram1D(h1py)
ROOT Jargon
“Profile” histogram is an average in 1 dimension, not a ‘profile’ as per the real meaning of the word.
“Projection” means integral.
Python Histogram Operations
Some of the above operations are provided in functions of pybdsim.Data.TH2 and pybdsim.Data.TH3 - the ‘Python’ versions in pybdsim.
See pybdsim.Data module and look for each of the classes there, where their functions are listed.
Some specifically for 3D histograms (i.e. often scoring meshes) are described below.
3D Scoring Histograms
When using scoring in BDSIM, 3D histograms are produced for 3D scoring meshes. In pybdsim, we have a few extra functions to help handle and inspect these. Plotting 3D is inherently difficult because it has to be viewed from multiple angles to be understood. A few small utility functions are provided to get individual slices and integrals along each dimension to save the user from the difficultly of using underlying ROOT histograms.
The functions are members of an instance of pybdsim.Data.TH3, the Python
version of the histogram.
pybdsim.Data.TH3.IntegrateAlong1Dimensionpybdsim.Data.TH3.IntegrateAlong2Dimensionspybdsim.Data.TH3.Slice2DXYpybdsim.Data.TH3.Slice2DXZpybdsim.Data.TH3.Slice2DXY
Examples:
h3d # assume an pybdsim.Data.TH3 instance
h2dx = h3d.IntegrateAlong1Dimension('x')  # return type pybdsim.Data.TH2
pybdsim.Plot.Histogram2D(h2dx)
for i in range(h3d.nbinsz):
    h2i = h3d.Slice2DXY(i)
    pybdsim.Plot.Histogram2D(h2i)
h1dz = h3d.IntegrateAlong2Dimension('z')
pybdsim.Plot.Histogram1D(h1dz)
Full documentation can be seen in the TH3 class documentation in the pybdsim.Data module documentation.
Manually Loading Raw Data
We can use ROOT direct if you prefer.
import ROOT
import pybdsim

pybdsim.Data.LoadROOTLibraries()
# this imports all of BDSIM's analysis classes and puts them inside ROOT

# we need to know the BDSIM C++ classes we want by name
d = ROOT.DataLoader("run1.root")
# now the same as pybdsim.Data.Load("run1.root")

model = pybdsim.Data.GetModelForPlotting(d)
Sampler Data
Warning
This is a simplified way of loading sampler data that “flattens” the structure losing all concept of which coordinate belongs to which event. This is not recommend, and this may perhaps not be efficient, but it is occasionally useful. If you want to make a histogram, use rebdsim. Only with this will the error bars be correct.
Sampler data can be trivially extracted from a raw BDSIM output file
>>> import pybdsim
>>> d = pybdsim.Data.Load("output.root")
>>> primaries = pybdsim.Data.SamplerData(d)
The optional second argument to SamplerData can be either the index of the sampler as counting from 0 including the primaries, or the name of the sampler.
>>> fq15x = pybdsim.Data.SamplerData(d, fq15x)
>>> thirdAfterPrimares = pybdsim.Data.SamplerData(d, 3)
A near-duplicate class exists called PhaseSpaceData that can extract only the variables most interesting for tracking (‘x’,’xp’,’y’,’yp’,’z’,’zp’,’energy’,’t’).
>>> psd1 = pybdsim.Data.PhaseSpaceData(d)
>>> psd2 = pybdsim.Data.PhaseSpaceData(d, fq15x)
>>> psd3 = pybdsim.Data.PhaseSpaceData(d, 3)