Plotting
pybdsim includes functions for common plots useful for BDSIM.
BDSIM Optics
With a model, use sample, all; in the input GMAD to give a sampler behind every
element. Then calculate the optics and plot just those on their own.
bdsim --file=mymodel.gmad --outfile=o1 --batch --ngenerate=5000
rebdsimOptics o1.root
ls
  o1.root   o1_optics.root
>>> pybdsim.Plot.BDSIMOptics("o1_optics.root")
Histogram Plotting
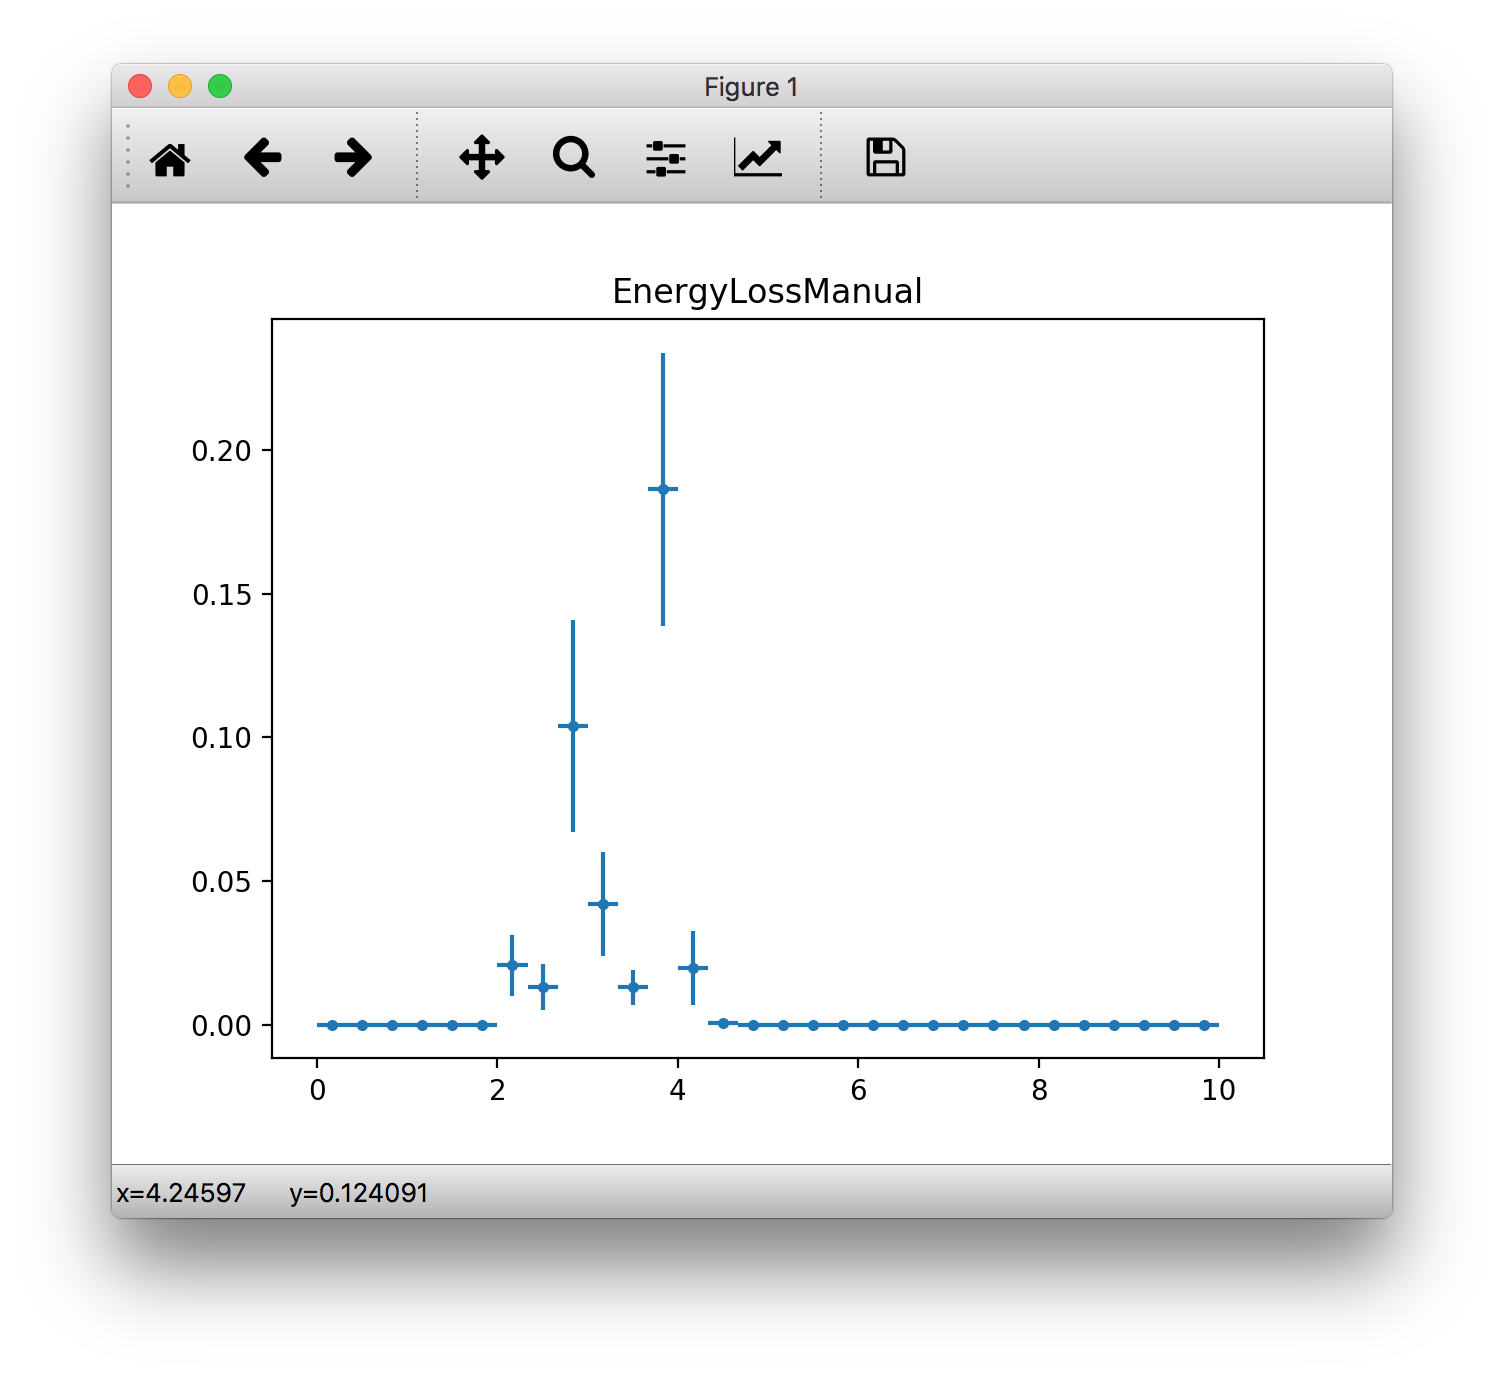
1D Histogram
Loaded histograms that are wrapped in our pybdsim.Data.THX classes can be plotted:
>>> pybdsim.Plot.Histogram1D(d.histogramspy['Event/PerEntryHistograms/EnergyLossManual'])
Note, the use of d.histogramspy for the wrapped set of histograms and not the raw ROOT histograms.
2D Histogram
See pybdsim.Plot.Histogram2D
Spectra
>>> d = pybdsim.Data.Load("ana1.root")
>>> d.spectra
    defaultdict(pybdsim.Data.Spectra,
            {'t10_0': <pybdsim.Data.Spectra at 0x28eaf3cd0>,
             'tax_0': <pybdsim.Data.Spectra at 0x290ed6f90>,
             'col1_0': <pybdsim.Data.Spectra at 0x290ed78d0>,
             'col2_0': <pybdsim.Data.Spectra at 0x290edc150>,
             'col3_0': <pybdsim.Data.Spectra at 0x290edca10>,
             'interface_0': <pybdsim.Data.Spectra at 0x290edd090>,
             'interface_1': <pybdsim.Data.Spectra at 0x290eddad0>})
>>> pybdsim.Plot.Spectra(d.spectra["t10_0"])
Energy Deposition
bdsim --file=mymodel.gmad --outfile=run1 --batch --ngenerate=1000
rebdsimHistoMerge run1.root
>>> pybdsim.Plot.EnergyDeposition("run1_histos.root")
Machine Diagrams For Plots
For a plot or histogram that follows the accelerator along its axis (e.g. S coordinate), it is common to draw a small schematic of the various elements in the accelerator above the plot. pybdsim provides functionality to make such diagrams using information from a BDSIM output file or from a MADX Twiss output in a TFS file.
Information is accepted from the following sources:
BDSIM raw output file (from bdsim, bdskim, bdsimCombine)
REBDSIM output file (from rebdsim or rebdsimCombine)
MADX Twiss output in a TFS file
BDSIM survey text output
Each can be supplied as either a string giving the file name or as an already loaded object in python.
The main function of interest is pybdsim.Plot.AddMachineLatticeFromSurveyToFigure.
REBDSIM Output
>>> import pybdsim
>>> d = pybdsim.Data.Load("ana1.root") # a rebdsim output file
>>> f = pybdsim.Plot.Histogram1D(d.histogramspy["Event/MergedHistograms/ElossHisto"])
>>> pybdsim.Plot.AddMachineLatticeFromSurveyToFigure(f, d.model)
or
>>> pybdsim.Plot.AddMachineLatticeFromSurveyToFigure(f, d)
or
>>> pybdsim.Plot.AddMachineLatticeFromSurveyToFigure(f, "ana1.root")
BDSIM Survey
bdsim --file=mymodel.gmad --output=none --batch --ngenerate=1 --survey=survey1
This produces the file survey1.dat for example, for some input model mymodel.gmad.
>>> import pybdsim
>>> d = pybdsim.Data.Load("ana1.root") # a rebdsim output file
>>> f = pybdsim.Plot.Histogram1D(d.histogramspy["Event/MergedHistograms/ElossHisto"])
>>> pybdsim.Plot.AddMachineLatticeFromSurveyToFigure(f, "survey.dat")